Filter
2670
Text search:
rate
difference
Featured
197
726
Language
2629
34
31
15
14
6
6
5
4
3
3
3
2
2
2
2
2
2
2
2
2
1
1
1
1
1
1
1
1
1
1
1
1
1
1
1
1
Document type
1743
505
206
106
45
26
23
9
5
1
1
Countries
142
97
85
75
70
63
59
57
53
53
52
50
50
49
47
43
43
35
33
29
29
26
24
23
23
22
22
21
20
19
19
18
18
15
15
13
13
11
11
10
10
9
9
8
8
8
8
8
7
7
6
6
6
6
5
5
5
5
5
5
5
5
4
4
4
4
4
4
3
3
3
3
3
3
3
2
2
2
2
2
2
2
2
2
2
2
2
2
2
1
1
1
1
1
1
1
1
1
1
1
1
1
1
1
1
1
1
1
1
1
1
1
1
1
Authors & Publishers
278
155
149
63
63
59
55
38
33
29
26
22
19
18
16
14
14
13
12
12
11
11
11
11
11
10
10
9
8
8
8
8
8
8
8
8
7
7
7
7
7
7
6
6
6
6
6
6
5
5
5
5
5
5
5
5
5
5
5
5
5
5
5
5
5
5
5
5
4
4
4
4
4
4
4
4
4
4
4
4
4
4
4
4
4
4
4
4
4
4
4
4
4
4
4
4
4
4
4
4
4
4
4
4
3
3
3
3
3
3
3
3
3
3
3
3
3
3
3
3
3
3
3
3
3
3
3
3
3
3
3
3
3
3
3
3
3
3
3
3
3
3
3
3
3
3
3
3
3
3
3
3
2
2
2
2
2
2
2
2
2
2
2
2
2
2
2
2
2
2
2
2
2
2
2
2
2
2
2
2
2
2
2
2
2
2
2
2
2
2
2
2
2
2
2
2
2
2
2
2
2
2
2
2
2
2
2
2
2
2
2
2
2
2
2
2
2
2
2
2
2
2
2
2
2
2
2
2
2
2
2
2
2
2
2
2
2
2
2
2
2
2
2
2
2
2
2
2
2
2
2
2
2
2
2
2
2
2
2
2
2
2
2
2
2
2
2
2
2
2
2
2
2
2
2
2
2
2
2
2
2
2
2
2
2
2
2
2
2
2
2
2
2
2
2
2
2
2
2
2
2
2
2
2
2
2
2
2
2
2
2
2
2
2
2
2
2
2
2
2
2
2
2
2
2
2
2
2
2
2
2
2
2
2
2
2
2
2
2
2
2
2
2
2
2
2
2
2
2
2
2
2
2
2
2
2
2
2
2
2
2
2
2
2
2
2
2
1
1
1
1
1
1
1
1
1
1
1
1
1
1
1
1
1
1
1
1
1
1
1
1
1
1
1
1
1
1
1
1
1
1
1
1
1
1
1
1
1
1
1
1
1
1
1
1
1
1
1
1
1
1
1
1
1
1
1
1
1
1
1
1
1
1
1
1
1
1
1
1
1
1
1
1
1
1
1
1
1
1
1
1
1
1
1
1
1
1
1
1
1
1
1
1
1
1
1
1
1
1
1
1
1
1
1
1
1
1
1
1
1
1
1
1
1
1
1
1
1
1
1
1
1
1
1
1
1
1
1
1
1
1
1
1
1
1
1
1
1
1
1
1
1
1
1
1
1
1
1
1
1
1
1
1
1
1
1
1
1
1
1
1
1
1
1
1
1
1
1
1
1
1
1
1
1
1
1
1
1
1
1
1
1
1
1
1
1
1
1
1
1
1
1
1
1
1
1
1
1
1
1
1
1
1
1
1
1
1
1
1
1
1
1
1
1
1
1
1
1
1
1
1
1
1
1
1
1
1
1
1
1
1
1
1
1
1
1
1
1
1
1
1
1
1
1
1
1
1
1
1
1
1
1
1
1
1
1
1
1
1
1
1
1
1
1
1
1
1
1
1
1
1
1
1
1
1
1
1
1
1
1
1
1
1
1
1
1
1
1
1
1
1
1
1
1
1
1
1
1
1
1
1
1
1
1
1
1
1
1
1
1
1
1
1
1
1
1
1
1
1
1
1
1
1
1
1
1
1
1
1
1
1
1
1
1
1
1
1
1
1
1
1
1
1
1
1
1
1
1
1
1
1
1
1
1
1
1
1
1
1
1
1
1
1
1
1
1
1
1
1
1
1
1
1
1
1
1
1
1
1
1
1
1
1
1
1
1
1
1
1
1
1
1
1
1
1
1
1
1
1
1
1
1
1
1
1
1
1
1
1
1
1
1
1
1
1
1
1
1
1
1
1
1
1
1
1
1
1
1
1
1
1
1
1
1
1
1
1
1
1
1
1
1
1
1
1
1
1
1
1
1
1
1
1
1
1
1
1
1
1
1
1
1
1
1
1
1
1
1
1
1
1
1
1
1
1
1
1
1
1
1
1
1
1
1
1
1
1
1
1
1
1
1
1
1
1
1
1
1
1
1
1
1
1
1
1
1
1
1
1
1
1
1
1
1
1
1
1
1
1
1
1
1
1
1
1
1
1
1
1
1
1
1
1
1
1
1
1
1
1
1
1
1
1
1
1
1
1
1
1
1
1
1
1
1
1
1
1
1
1
1
1
1
1
1
1
1
1
1
1
1
1
1
1
1
1
1
1
1
1
1
1
1
1
1
1
1
1
1
1
1
1
1
1
1
1
1
1
1
1
1
1
1
1
1
1
1
1
1
1
1
1
1
1
1
1
1
1
1
1
1
1
1
1
1
1
1
1
1
1
1
1
1
1
1
1
1
1
1
1
1
1
1
1
1
1
1
1
1
1
1
1
1
1
1
1
1
1
1
1
1
1
1
1
1
1
1
1
1
1
1
1
1
1
1
1
1
1
1
1
1
1
1
1
1
1
1
1
1
1
1
1
1
1
1
1
1
1
1
1
1
1
1
1
1
1
1
1
1
1
1
1
1
1
1
1
1
1
1
1
1
1
1
1
1
1
1
1
1
1
1
1
1
1
1
1
1
1
1
1
1
1
1
1
1
1
1
1
1
1
1
1
1
1
1
1
1
1
1
1
1
1
1
1
1
1
1
1
1
1
1
1
1
1
1
1
1
1
1
1
1
1
1
1
1
1
1
1
1
1
1
1
1
1
1
1
1
1
1
1
1
1
1
1
1
1
1
1
1
1
1
1
1
1
1
1
1
1
1
1
1
1
1
1
1
1
1
1
1
1
1
1
1
1
1
1
1
1
1
1
1
1
1
1
1
1
1
1
1
1
1
1
1
1
1
1
1
1
1
1
1
1
1
1
1
1
1
1
1
1
1
1
1
1
1
1
1
1
1
1
1
1
1
1
1
1
1
1
1
1
1
1
1
1
1
1
1
1
1
1
1
1
1
1
1
1
1
1
1
1
1
1
1
1
1
1
1
1
1
1
1
1
1
1
1
1
1
1
1
1
1
1
1
1
1
1
1
1
1
1
1
1
1
1
1
1
1
1
1
1
1
1
1
1
1
1
1
1
1
1
1
1
1
1
1
1
1
1
1
1
1
1
1
1
1
1
1
1
1
1
1
1
1
1
1
1
1
1
1
1
1
1
1
1
1
1
1
1
1
1
1
1
1
1
1
1
1
1
1
1
1
1
1
1
1
1
1
1
1
1
1
1
1
1
1
1
1
1
1
1
1
1
1
1
1
1
1
1
1
1
1
1
1
1
1
1
1
1
1
1
1
1
1
1
1
1
1
1
1
1
1
1
1
1
1
1
1
1
1
1
1
1
1
1
1
1
1
1
1
1
1
1
1
1
1
1
1
1
1
1
1
1
1
1
1
1
1
1
1
1
1
1
1
1
1
1
1
1
1
1
1
1
1
1
1
1
1
1
1
1
1
1
1
1
1
1
1
1
1
1
1
1
1
1
1
1
1
1
1
1
1
1
1
1
1
1
1
1
1
1
1
1
1
1
1
1
1
1
1
1
1
1
1
1
1
1
1
1
1
1
1
1
1
1
1
1
1
1
1
1
1
1
1
1
1
1
1
1
1
1
1
1
1
1
1
1
1
1
1
1
1
1
1
1
1
1
1
1
1
1
1
1
1
1
1
1
1
1
1
1
1
1
1
1
1
1
1
1
1
1
1
1
1
1
1
1
1
1
1
1
1
1
1
1
1
1
1
1
1
1
1
1
1
1
1
1
1
1
1
1
1
1
1
1
1
1
1
1
1
1
1
1
1
1
1
1
1
1
1
1
1
1
1
1
1
1
1
1
1
1
1
1
1
1
1
1
1
1
1
1
1
1
1
1
1
1
1
1
1
1
1
1
1
1
1
1
1
1
1
1
1
1
1
1
1
1
1
1
1
1
1
1
1
1
1
1
1
1
1
1
1
1
1
1
1
1
1
1
1
1
1
1
1
1
1
1
1
1
1
1
1
1
1
1
1
1
1
1
1
1
1
1
1
1
1
1
1
1
1
1
1
1
1
1
1
1
1
1
1
1
1
1
1
1
1
1
1
1
1
1
1
1
1
1
1
1
1
1
1
1
1
1
1
1
1
1
1
1
1
1
1
1
1
1
1
1
1
1
1
1
1
1
1
1
1
1
1
1
1
1
1
1
1
1
1
1
1
1
1
1
1
1
1
1
1
1
1
1
1
1
1
1
1
1
1
1
1
1
1
1
1
1
1
1
1
1
1
1
1
1
1
1
1
1
1
1
1
1
1
1
1
1
1
1
1
1
1
1
1
1
1
1
1
1
1
1
1
1
1
1
1
1
1
1
1
1
1
1
1
1
1
1
1
1
1
1
1
1
1
1
1
1
1
1
1
1
1
1
1
1
1
1
1
1
1
1
1
1
1
1
1
1
1
1
1
1
1
1
1
1
1
1
1
1
1
1
1
1
1
1
1
1
1
1
1
1
1
1
1
1
1
1
1
1
1
1
1
1
1
1
1
1
1
1
1
1
1
1
1
1
1
1
1
1
1
1
1
1
1
1
1
1
1
1
1
1
1
1
1
1
1
1
1
1
1
1
1
1
1
1
1
1
1
1
1
1
1
1
1
1
1
1
1
1
1
1
1
1
1
1
1
1
1
1
1
1
1
1
1
1
1
1
1
1
1
1
1
1
1
1
1
1
1
1
1
1
1
1
1
1
1
1
1
1
1
1
1
1
1
1
1
1
1
1
1
1
1
1
1
1
1
1
1
1
1
1
1
1
1
1
1
1
1
1
1
1
1
1
1
1
1
1
1
1
1
1
1
1
1
1
1
1
1
1
1
1
1
1
1
1
1
1
1
1
1
1
1
1
1
1
1
1
1
1
1
1
1
1
1
1
1
1
1
1
1
1
1
1
1
1
1
1
1
1
1
1
1
1
1
1
1
1
1
1
1
1
1
1
1
1
1
1
1
1
1
1
1
1
1
1
1
1
1
1
1
1
1
1
1
1
1
1
1
1
1
1
1
1
1
1
1
1
1
1
1
1
1
1
1
1
1
1
1
1
1
1
1
1
1
1
1
1
1
1
1
1
1
1
1
1
1
1
1
1
1
1
1
1
1
1
1
1
1
1
1
1
1
1
1
1
1
1
1
1
1
1
1
1
1
1
1
1
1
1
1
1
1
1
1
1
1
1
1
1
1
1
1
1
1
1
1
1
1
1
1
1
1
1
1
1
1
1
1
1
1
1
1
1
1
1
1
1
1
1
1
1
1
1
1
1
1
1
1
1
1
1
1
1
1
1
1
1
1
1
1
1
1
1
1
1
1
1
1
1
1
1
1
1
1
1
1
1
1
1
1
1
1
1
1
1
1
1
1
1
1
1
1
1
1
1
1
1
1
1
1
1
1
1
1
1
1
1
1
1
1
1
1
1
1
1
1
1
1
1
1
1
1
1
1
1
1
1
1
1
1
1
1
1
1
1
1
1
1
1
1
1
1
1
1
1
1
1
1
1
1
1
1
1
1
1
1
1
1
1
1
1
1
1
1
1
1
1
1
1
1
1
1
1
1
1
1
1
1
1
1
1
1
1
1
1
1
1
1
1
1
1
1
1
1
1
1
1
1
1
1
1
1
1
1
1
1
1
1
1
1
1
1
1
1
1
1
1
1
1
1
1
1
1
1
1
1
1
1
1
1
1
1
1
1
1
1
1
1
1
1
1
1
1
1
1
1
1
1
1
1
1
1
1
1
1
1
1
1
1
1
1
1
1
1
1
1
1
1
1
1
1
1
1
1
1
1
1
1
1
1
1
1
1
1
1
1
1
1
1
1
1
1
1
1
1
1
1
1
1
1
1
1
1
1
1
1
1
1
1
1
1
1
1
1
1
1
1
1
1
1
1
1
1
1
1
1
1
1
1
1
1
1
1
1
1
1
1
1
1
1
1
1
1
1
1
1
1
1
1
1
1
1
1
1
1
1
1
1
1
1
1
1
1
1
1
1
1
1
1
1
1
1
1
1
1
1
1
1
1
1
1
1
1
1
1
1
1
1
1
1
1
1
1
1
1
1
1
1
1
1
1
1
1
1
1
1
1
1
1
1
1
1
1
1
1
1
1
1
1
1
1
1
1
1
1
1
1
1
1
1
1
1
1
1
1
1
1
1
1
1
1
1
1
1
1
1
1
1
1
1
1
1
1
1
1
1
1
1
1
1
1
1
1
1
1
1
1
1
1
1
1
1
1
1
1
1
1
1
1
1
1
1
1
1
1
1
1
1
1
1
1
1
1
1
1
1
1
1
1
1
1
1
1
1
1
1
1
1
1
1
1
1
1
1
1
1
1
1
1
1
1
1
1
1
1
1
1
1
1
1
1
1
1
1
1
1
1
1
1
1
1
1
1
1
1
1
1
1
1
1
1
1
1
1
1
1
1
1
1
1
1
1
1
1
1
1
1
1
1
1
1
1
1
1
1
1
1
1
1
1
1
1
1
1
1
1
1
1
1
1
1
1
1
1
1
1
1
1
1
1
1
1
1
1
1
1
1
1
1
1
1
1
1
1
1
1
1
1
1
1
1
1
1
1
1
1
1
1
1
1
1
1
1
1
1
1
1
1
1
1
1
1
1
1
1
Publication Years
506
1835
319
8
2
Category
1092
230
140
131
76
49
18
1
Toolboxes
243
223
145
128
128
99
67
59
59
54
50
48
48
41
38
36
24
23
14
12
10
8
5
2
1
Globally, in low-income countries, the average newborn mortality rate is 27 deaths per 1,000 births, the report says. In high-income countries, that rate is 3 deaths per 1,000. Newborns from the ris
...
kiest places to give birth are up to 50 times more likely to die than those from the safest places.
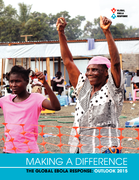
The report also notes that 8 of the 10 most dangerous places to be born are in sub-Saharan Africa, where pregnant women are much less likely to receive assistance during delivery due to poverty, conflict and weak institutions. If every country brought its newborn mortality rate down to the high-income average by 2030, 16 million lives could be saved.
More than 80 per cent of newborn deaths are due to prematurity, complications during birth or infections such as pneumonia and sepsis, the report says. These deaths can be prevented with access to well-trained midwives, along with proven solutions like clean water, disinfectants, breastfeeding within the first hour, skin-to-skin contact and good nutrition. more
Nepal has made substantial progress in reducing under-five mortality and is on track to achieve Millennium Development Goal 4, but advances in neonatal health are less encouraging. The objectives of this study were to assess relative and absolute inequalities in neonatal mortality over time, and to
...
review experience with major programs to promote neonatal health.
more
Census Report Volume 4-A
This thematic report presents findings on fertility and nuptiality in Myanmar. The analysis hows that the total fertility rate is 2.5 children per woman at the Union level, 1.9 children per woman for urban areas, and 2. ... 8 children per woman for rural areas. Total fertility for States and Regions varies from a high of 5.0 children per woman for Chin State to a low of 1.8 children per woman for Yangon Region. Total fertility appears to have declined at a rate of at least one child per woman per decade between 1970 and 2000. This relatively rapid decline apparently ceased sometime during the 1990s or 2000s. Estimates from the 2001 and 2007 surveys suggest that the level of fertility may have fluctuated between 2000 and 2014, but with no overall trend up or down. The marital status data shows an exceptionally high proportion of women remaining never married at age 50. more
This thematic report presents findings on fertility and nuptiality in Myanmar. The analysis hows that the total fertility rate is 2.5 children per woman at the Union level, 1.9 children per woman for urban areas, and 2. ... 8 children per woman for rural areas. Total fertility for States and Regions varies from a high of 5.0 children per woman for Chin State to a low of 1.8 children per woman for Yangon Region. Total fertility appears to have declined at a rate of at least one child per woman per decade between 1970 and 2000. This relatively rapid decline apparently ceased sometime during the 1990s or 2000s. Estimates from the 2001 and 2007 surveys suggest that the level of fertility may have fluctuated between 2000 and 2014, but with no overall trend up or down. The marital status data shows an exceptionally high proportion of women remaining never married at age 50. more
Census Report Volume 4-B
In the 2014 Census, early-age mortality was measured from the responses to two simple retrospective questions on childbearing addressed to ever-married women aged 15 and over. These questions referred to how many live children they had ever given birth to, and how many ... had died (or survived). Adult mortality was measured by using a question on the number of household members who had died during the 12 months preceding the Census.
According to the 2014 Census, infant and child mortality, which comprises under-five mortality, was high compared to other countries in the region. Previous estimates indicated a rapid decline during the 1960s and 1970s, with a substantial deceleration starting in the early 1980s. The decline has accelerated again during recent years. more
Census Report Volume 4-E
As no census has been undertaken in over 30 years, many aspects of the demographic situation in the country were unknown. For instance, before the Census it was thought that the country had a population of about 60 million, but the 2014 Census showed that the population ... (including an estimate for under-enumeration) was 51,486,253 persons, around 8.5 million less than the previous estimate.
In the 1983 census, 35,307,913 persons were recorded. Therefore between 1983 and 2014, the population increased by 46 per cent. With an average annual population growth rate of 0.89 per cent between 2003 and 2014, Myanmar is one of the slowest growing countries in Southeast Asia. more
This report provides a comprehensive overview of the progress made by India in terms of establishment and functionality of Special Newborn Care Units (SNCUs) during the two year period from April 2013 to March 2015. It describes the progress in the operational status (numbers, bed strength, human re
...
source availability), the profile of babies admitted in these units and of those babies who died during stay. In addition it provides individual state specific statistics to facilitate differential planning and better monitoring of these units in India.
more
HIV status disclosure rate and reasons for non-disclosure among infected children and adolescents in Enugu, southeast Nigeria
A.C. Ubesie; K.K. Iloh; I.J. Emodi; et al.
SAHARA-J: Journal of Social Aspects of HIVAIDS; Taylor & Francis Group
(2016)
CC
Journal of Social Aspects of HIV/AIDS VOL. 13 NO. 1 2016
To link to this article: https://doi.org/10.1080/17290376.2016.1226942
Census Report Volume 4-F (Thematic report on Population Projections for the Union of Myanmar, States/Regions, Rural and Urban Areas, 2014-2050)
Key findings
- The total population of Myanmar is estimated to be 65 million by 2050. The projection is based on steadily declining population grow ... th rate over the projection period: from 0.9 per cent in 2015 to 0.3 per cent in 2050.
- The proportion of the urban population rises from 29.3 per cent in 2015 to 34.7 in 2050. The rural and urban crude birth rates both decline between 2015 and 2050, but the difference between them narrows to almost zero by the end of the period.
- The population of Yangon grows more rapidly than any other area, by 39 per cent between 2015 and 2031. Other rapidly growing areas include Kayah (37 per cent), Kachin (32 per cent), Nay Pyi Taw (27 per cent), and Shan (26 per cent). Ayeyawady, Magway and Mon lose population, mostly due to migration. more

National Tuberculosis Programme
The National Strategic Plan (NSP) for Tuberculosis (TB) 2016-2020 builds on the past experiences for the National Tuberculosis Programme and its partners. This NSP provides a roadmap for delivering quality TB prevention and care service to the entire population, ... as an integral part of the country's move toward Universal Health Coverage. Between 1990 and 2015, Myanmar reduced the prevalence of TB by 50%, meeting the targets set by the Millennium Development Goals. Going forward, the country aims to further accelerate the rate decline. more
The National Strategic Plan (NSP) for Tuberculosis (TB) 2016-2020 builds on the past experiences for the National Tuberculosis Programme and its partners. This NSP provides a roadmap for delivering quality TB prevention and care service to the entire population, ... as an integral part of the country's move toward Universal Health Coverage. Between 1990 and 2015, Myanmar reduced the prevalence of TB by 50%, meeting the targets set by the Millennium Development Goals. Going forward, the country aims to further accelerate the rate decline. more

A STUDY OF THE CHALLENGES FACED BY PERSONS WITH DISABILITIES IN POST-EARTHQUAKE
NEPAL.
The Health Equity Assessment Toolkit (HEAT) is a software application for use on desktop or laptop computers and mobile devices (minimum screen size of 7.9 inches recommended). It was developed to facilitate the assessment of within-country health inequalities. The Built-in Database Edition, Version
...
1.0 is available as an online application and as a standalone version for download
more
Rwanda 2010: A Dramatic Change in Reproductive Behavior
Westoff, C.F., F. Ngabo, C. Munyanshongore, M.A. Umubyeyi, and E. Kagame
Calverton, Maryland, USA: ICF International.
(2013)
C2
DHS Further Analysis Reports No. 90 - In Rwanda, between 2005 and 2010, there have been radical declines in the desired number of children, actual fertility, and child mortality along with a large increase in contraceptive prevalence. This study reviews trends in some of these measures. Multivariate
...
analyses evaluate the relative importance for
the desired number of children of years of schooling, wealth, urban residence, media exposure, child mortality, and attitudes toward gender equality. Variations in reproductive preferences, the total fertility rate, and unmet need for family planning are mapped for the 30 districts of Rwanda. The explanations for the rapid changes in reproductive attitudes and behavior are clearly related to the concerns of the country, the rapid rate of population growth, and its implications for economic development and reproductive health.
more
Lancet Glob Health 2018 Published Online September 12, 2018 http://dx.doi.org/10.1016/S2214-109X(18)30407-8
DHS Further Analysis Reports No. 107 - This report, based largely on the 2014-15 national survey in Rwanda, focuses on changes and trends in reproductive behavior since 2010. In the 4-5 years after the 2010 survey, fertility continued its decline to 4.2 births per woman as contraceptive prevalence i
...
ncreased slightly. However, the earlier downward trend in number of children desired appears stalled. This is clearly evident from an increase in the proportions of married women and men who say they want more children. Child mortality has significantly declined and remains strongly related to fertility; while age at marriage has continued to increase. The demographic goals specified in the 1998-99 plan for development, Rwanda Vision 2020, appear on track, but the annual rate of population growth remains high, currently 2.5%, because fertility is high. Furthermore, large numbers of young people are now entering their child-bearing years. Although most trends seem encouraging, especially compared with other countries in sub-Saharan Africa, significant population growth is expected in Rwanda, from 12 to 16 million people by 2030, and to 22 million people by mid-century, even with assumed reductions of fertility.
more
Census Report Volume 4-L
Myanmar’s 2014 Census enumerated 4.5 million people aged 60 and over and by 2050 Myanmar is projected to have 13 million people in this age group.
Myanmar’s population has aged between 1973 and 2014; while the total population increased at an annual ... rate of 1.4 per cent, the population aged 60 and over increased annually by 2.4 per cent. Within the older population, the oldest age group, those over 80 years old, has been growing much faster than those aged 60-79. In 2014, the urban population was slightly older than the rural population. This is the result of a more rapid decline in urban fertility, offset by net migration to urban areas by youth and young adults. more
The Democratic Republic of Timor-Leste has the highest TB incidence rate in the South East Asian Region - 498 per 100,000, which is the seventh highest in the world. In Timor-Leste TB is the eighth most common cause of death.
The salient observat
...
ions are as follows:
In 2018, 487 (12.5%) of the 3906 notified TB patients were tested for RR-TB and only 12 lab confirmed RR-TB patients were initiated on standard MDR-TB treatment of 20-months duration, (a 3-fold increase in RR-TB detection compared with 2017). This amounts to treatment coverage of only 17% of 72 estimated MDR/RR-TB among notified TB patients (3906) and 5% of 240 estimated incident MDR-TB patients as compared to 62% treatment coverage of 6300 incident drug sensitive TB patients estimated in TLS. The treatment success in the 2016 annual cohort of 6 MDR-TB patients has been reported at 83%. 80% of TB patients know their HIV Status with around 1% TB-HIV co-infection, 37/ 77 (48%) TB-HIV Co-infection Detected. Of the 387 PLHIV currently alive on ART, exact status on TB screening and testing is unknown. % of PLHIV newly enrolled in HIV care who received IPT is not known.
In 2018, the mortality rate for TB was 94 deaths per 100,000 people (1200 per annum) in TL with an increasing mortality trend (Figure 1), despite TB services being available for nearly two decades.
A survey of catastrophic costs due to TB (2016) highlights that 83% of TB patients are reported to be facing catastrophic costs due to the disease. This is the highest rate in the world.
more