Filter
436
Text search:
graphs
Featured
27
116
Language
Document type
261
92
29
22
12
9
6
4
1
Countries
18
18
18
10
9
9
8
8
8
8
8
8
7
7
7
6
6
6
6
6
6
5
5
5
5
4
4
3
3
3
3
2
2
2
2
2
2
2
2
2
2
2
1
1
1
1
1
1
1
1
1
1
1
1
1
1
1
1
1
1
1
1
1
1
1
1
1
1
1
1
Authors & Publishers
Publication Years
Category
174
25
24
22
22
17
2
1
Toolboxes
35
29
22
19
19
17
16
12
12
11
11
11
10
9
8
6
5
5
5
4
3
2
1
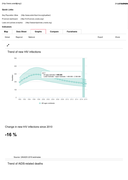
Source: Global Tuberculosis Report 2015
http://www.who.int/tb/publications/global_report/en/
Accessed: 05.10.2019
Accesseds: 20.10.2019
Accessed: 20.10.2019
Accessed: 05.10.2019
Accessed: 20.10.2019
Five years after a global commitment to Fast-Track the HIV response and end AIDS by 2030, the world is off track. A promise to build on the momentum created in the first decade of the twenty-first century by front-loading investment and accelerating HIV service provision has been fulfilled by too fe
...
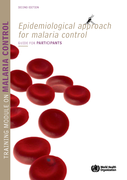
Training Module on Malaria
Epidemic diarrhoeal disease preparedness and response. Training and practice. Participant's manual
recommended
Accessed November 2014
2nd edition. Training module on malaria control
A user-friendly instrument designed to collect and calculate indicators of effective inventory management. The IMAT guides the user through a process of collecting data on the physical and theoretical stock balance and the duration of stockouts for a set of up to 25 frequently-used products, calcula
...
The toolkit's purpose is to:
improve the primary health care response for older persons.
sensitize and educate primary health care workers about the specific needs of their older clients.
provide primary care health workers with a set of tools/instruments to assess older people's hea
...


In 2014 UNICEF, WHO and the World Bank report new joint estimates of child malnutrition using available data up to 2013 The Interactive dashboard allows users to generate a variety of graphs and charts, using the newest joint estimates of prevalence
...
• provide scientific information on the safety, efficacy, and quality control/ quality assurance of widely used medicinal plants, in order to facilitate their appropriate use in Member States;
• provide models to assist Member States in developing their own mono-
...
• provide scientific information on the safety, efficacy, and quality control/ quality assurance of widely used medicinal plants, in order to facilitate their appropriate use in Member States;
• provide models to assist Member States in developing their own mono-
...
• provide scientific information on the safety, efficacy, and quality control/ quality assurance of widely used medicinal plants, in order to facilitate their appropriate use in Member States;
• provide models to assist Member States in developing their own mono-
...