Filter
5447
Text search:
estimates
Featured
363
1520
Language
5239
130
121
87
61
36
36
24
6
6
5
5
5
4
4
3
3
3
3
3
2
2
2
2
2
2
2
1
1
1
1
1
1
1
1
1
1
1
1
1
1
1
1
1
1
1
1
1
1
1
Document type
3140
1215
478
192
171
104
55
39
27
19
3
2
2
Countries
298
213
172
122
114
113
101
100
99
99
98
94
94
89
88
88
86
76
76
76
67
64
56
55
50
50
49
48
43
41
40
40
40
36
35
33
28
27
25
25
25
24
24
23
22
22
21
20
19
19
17
17
16
13
13
12
12
12
10
10
10
10
10
9
9
9
9
9
8
8
8
7
7
7
6
6
6
6
6
5
5
5
5
5
4
4
4
4
4
4
4
4
3
3
3
3
3
3
3
3
3
3
3
3
2
2
2
2
2
2
2
2
2
2
2
2
1
1
1
1
1
1
1
1
1
1
1
1
1
1
1
1
1
1
1
1
1
1
1
Authors & Publishers
657
286
279
230
182
147
126
86
74
68
36
31
28
27
25
25
25
25
25
24
24
21
21
21
20
20
20
19
19
18
18
18
18
17
17
17
17
17
17
16
16
16
16
16
14
14
14
14
14
13
13
13
13
12
12
11
11
11
11
11
10
10
9
9
9
9
9
9
9
9
9
8
8
8
8
8
8
8
8
8
8
8
7
7
7
7
7
7
7
7
7
7
7
7
7
7
7
7
7
7
6
6
6
6
6
6
6
6
6
6
6
6
6
6
6
6
6
6
6
6
5
5
5
5
5
5
5
5
5
5
5
5
5
5
5
5
5
5
5
5
5
5
5
5
5
5
5
5
5
5
5
5
5
5
5
5
5
4
4
4
4
4
4
4
4
4
4
4
4
4
4
4
4
4
4
4
4
4
4
4
4
4
4
4
4
4
4
4
4
4
4
4
4
4
4
4
4
4
4
4
4
4
4
4
4
4
4
4
4
4
4
4
4
4
4
4
4
4
4
4
3
3
3
3
3
3
3
3
3
3
3
3
3
3
3
3
3
3
3
3
3
3
3
3
3
3
3
3
3
3
3
3
3
3
3
3
3
3
3
3
3
3
3
3
3
3
3
3
3
3
3
3
3
3
3
3
3
3
3
3
3
3
3
3
3
3
3
3
3
3
3
3
3
3
3
3
3
3
3
3
3
3
3
3
3
3
3
3
3
3
3
3
3
3
3
3
3
3
3
3
3
3
3
3
3
3
3
3
3
3
3
3
3
3
3
3
3
3
3
3
3
3
2
2
2
2
2
2
2
2
2
2
2
2
2
2
2
2
2
2
2
2
2
2
2
2
2
2
2
2
2
2
2
2
2
2
2
2
2
2
2
2
2
2
2
2
2
2
2
2
2
2
2
2
2
2
2
2
2
2
2
2
2
2
2
2
2
2
2
2
2
2
2
2
2
2
2
2
2
2
2
2
2
2
2
2
2
2
2
2
2
2
2
2
2
2
2
2
2
2
2
2
2
2
2
2
2
2
2
2
2
2
2
2
2
2
2
2
2
2
2
2
2
2
2
2
2
2
2
2
2
2
2
2
2
2
2
2
2
2
2
2
2
2
2
2
2
2
2
2
2
2
2
2
2
2
2
2
2
2
2
2
2
2
2
2
2
2
2
2
2
2
2
2
2
2
2
2
2
2
2
2
2
2
2
2
2
2
2
2
2
2
2
2
2
2
2
2
2
2
2
2
2
2
2
2
2
2
2
2
2
2
2
2
2
2
2
2
2
2
2
2
2
2
2
2
2
2
2
2
2
2
2
2
2
2
2
2
2
2
2
2
2
2
2
2
2
2
2
2
2
2
2
2
2
2
2
2
2
2
2
2
2
2
2
2
2
2
2
2
2
2
2
2
2
2
2
2
2
2
2
2
2
2
2
2
2
2
2
2
2
2
2
2
2
2
2
2
2
2
2
2
2
2
2
2
2
2
2
2
2
2
2
2
2
1
1
1
1
1
1
1
1
1
1
1
1
1
1
1
1
1
1
1
1
1
1
1
1
1
1
1
1
1
1
1
1
1
1
1
1
1
1
1
1
1
1
1
1
1
1
1
1
1
1
1
1
1
1
1
1
1
1
1
1
1
1
1
1
1
1
1
1
1
1
1
1
1
1
1
1
1
1
1
1
1
1
1
1
1
1
1
1
1
1
1
1
1
1
1
1
1
1
1
1
1
1
1
1
1
1
1
1
1
1
1
1
1
1
1
1
1
1
1
1
1
1
1
1
1
1
1
1
1
1
1
1
1
1
1
1
1
1
1
1
1
1
1
1
1
1
1
1
1
1
1
1
1
1
1
1
1
1
1
1
1
1
1
1
1
1
1
1
1
1
1
1
1
1
1
1
1
1
1
1
1
1
1
1
1
1
1
1
1
1
1
1
1
1
1
1
1
1
1
1
1
1
1
1
1
1
1
1
1
1
1
1
1
1
1
1
1
1
1
1
1
1
1
1
1
1
1
1
1
1
1
1
1
1
1
1
1
1
1
1
1
1
1
1
1
1
1
1
1
1
1
1
1
1
1
1
1
1
1
1
1
1
1
1
1
1
1
1
1
1
1
1
1
1
1
1
1
1
1
1
1
1
1
1
1
1
1
1
1
1
1
1
1
1
1
1
1
1
1
1
1
1
1
1
1
1
1
1
1
1
1
1
1
1
1
1
1
1
1
1
1
1
1
1
1
1
1
1
1
1
1
1
1
1
1
1
1
1
1
1
1
1
1
1
1
1
1
1
1
1
1
1
1
1
1
1
1
1
1
1
1
1
1
1
1
1
1
1
1
1
1
1
1
1
1
1
1
1
1
1
1
1
1
1
1
1
1
1
1
1
1
1
1
1
1
1
1
1
1
1
1
1
1
1
1
1
1
1
1
1
1
1
1
1
1
1
1
1
1
1
1
1
1
1
1
1
1
1
1
1
1
1
1
1
1
1
1
1
1
1
1
1
1
1
1
1
1
1
1
1
1
1
1
1
1
1
1
1
1
1
1
1
1
1
1
1
1
1
1
1
1
1
1
1
1
1
1
1
1
1
1
1
1
1
1
1
1
1
1
1
1
1
1
1
1
1
1
1
1
1
1
1
1
1
1
1
1
1
1
1
1
1
1
1
1
1
1
1
1
1
1
1
1
1
1
1
1
1
1
1
1
1
1
1
1
1
1
1
1
1
1
1
1
1
1
1
1
1
1
1
1
1
1
1
1
1
1
1
1
1
1
1
1
1
1
1
1
1
1
1
1
1
1
1
1
1
1
1
1
1
1
1
1
1
1
1
1
1
1
1
1
1
1
1
1
1
1
1
1
1
1
1
1
1
1
1
1
1
1
1
1
1
1
1
1
1
1
1
1
1
1
1
1
1
1
1
1
1
1
1
1
1
1
1
1
1
1
1
1
1
1
1
1
1
1
1
1
1
1
1
1
1
1
1
1
1
1
1
1
1
1
1
1
1
1
1
1
1
1
1
1
1
1
1
1
1
1
1
1
1
1
1
1
1
1
1
1
1
1
1
1
1
1
1
1
1
1
1
1
1
1
1
1
1
1
1
1
1
1
1
1
1
1
1
1
1
1
1
1
1
1
1
1
1
1
1
1
1
1
1
1
1
1
1
1
1
1
1
1
1
1
1
1
1
1
1
1
1
1
1
1
1
1
1
1
1
1
1
1
1
1
1
1
1
1
1
1
1
1
1
1
1
1
1
1
1
1
1
1
1
1
1
1
1
1
1
1
1
1
1
1
1
1
1
1
1
1
1
1
1
1
1
1
1
1
1
1
1
1
1
1
1
1
1
1
1
1
1
1
1
1
1
1
1
1
1
1
1
1
1
1
1
1
1
1
1
1
1
1
1
1
1
1
1
1
1
1
1
1
1
1
1
1
1
1
1
1
1
1
1
1
1
1
1
1
1
1
1
1
1
1
1
1
1
1
1
1
1
1
1
1
1
1
1
1
1
1
1
1
1
1
1
1
1
1
1
1
1
1
1
1
1
1
1
1
1
1
1
1
1
1
1
1
1
1
1
1
1
1
1
1
1
1
1
1
1
1
1
1
1
1
1
1
1
1
1
1
1
1
1
1
1
1
1
1
1
1
1
1
1
1
1
1
1
1
1
1
1
1
1
1
1
1
1
1
1
1
1
1
1
1
1
1
1
1
1
1
1
1
1
1
1
1
1
1
1
1
1
1
1
1
1
1
1
1
1
1
1
1
1
1
1
1
1
1
1
1
1
1
1
1
1
1
1
1
1
1
1
1
1
1
1
1
1
1
1
1
1
1
1
1
1
1
1
1
1
1
1
1
1
1
1
1
1
1
1
1
1
1
1
1
1
1
1
1
1
1
1
1
1
1
1
1
1
1
1
1
1
1
1
1
1
1
1
1
1
1
1
1
1
1
1
1
1
1
1
1
1
1
1
1
1
1
1
1
1
1
1
1
1
1
1
1
1
1
1
1
1
1
1
1
1
1
1
1
1
1
1
1
1
1
1
1
1
1
1
1
1
1
1
1
1
1
1
1
1
1
1
1
1
1
1
1
1
1
1
1
1
1
1
1
1
1
1
1
1
1
1
1
1
1
1
1
1
1
1
1
1
1
1
1
1
1
1
1
1
1
1
1
1
1
1
1
1
1
1
1
1
1
1
1
1
1
1
1
1
1
1
1
1
1
1
1
1
1
1
1
1
1
1
1
1
1
1
1
1
1
1
1
1
1
1
1
1
1
1
1
1
1
1
1
1
1
1
1
1
1
1
1
1
1
1
1
1
1
1
1
1
1
1
1
1
1
1
1
1
1
1
1
1
1
1
1
1
1
1
1
1
1
1
1
1
1
1
1
1
1
1
1
1
1
1
1
1
1
1
1
1
1
1
1
1
1
1
1
1
1
1
1
1
1
1
1
1
1
1
1
1
1
1
1
1
1
1
1
1
1
1
1
1
1
1
1
1
1
1
1
1
1
1
1
1
1
1
1
1
1
1
1
1
1
1
1
1
1
1
1
1
1
1
1
1
1
1
1
1
1
1
1
1
1
1
1
1
1
1
1
1
1
1
1
1
1
1
1
1
1
1
1
1
1
1
1
1
1
1
1
1
1
1
1
1
1
1
1
1
1
1
1
1
1
1
1
1
1
1
1
1
1
1
1
1
1
1
1
1
1
1
1
1
1
1
1
1
1
1
1
1
1
1
1
1
1
1
1
1
1
1
1
1
1
1
1
1
1
1
1
1
1
1
1
1
1
1
1
1
1
1
1
1
1
1
1
1
1
1
1
1
1
1
1
1
1
1
1
1
1
1
1
1
1
1
1
1
1
1
1
1
1
1
1
1
1
1
1
1
1
1
1
1
1
1
1
1
1
1
1
1
1
1
1
1
1
1
1
1
1
1
1
1
1
1
1
1
1
1
1
1
1
1
1
1
1
1
1
1
1
1
1
1
1
1
1
1
1
1
1
1
1
1
1
1
1
1
1
1
1
1
1
1
1
1
1
1
1
1
1
1
1
1
1
1
1
1
1
1
1
1
1
1
1
1
1
1
1
1
1
1
1
1
1
1
1
1
1
1
1
1
1
1
1
1
1
1
1
1
1
1
1
1
1
1
1
1
1
1
1
1
1
1
1
1
1
1
1
1
1
1
1
1
1
1
1
1
1
1
1
1
1
1
1
1
1
1
1
1
1
1
1
1
1
1
1
1
1
1
1
1
1
1
1
1
1
1
1
1
1
1
1
1
1
1
1
1
1
1
1
1
1
1
1
1
1
1
1
1
1
1
1
1
1
1
1
1
1
1
1
1
1
1
1
1
1
1
1
1
1
1
1
1
1
1
1
1
1
1
1
1
1
1
1
1
1
1
1
1
1
1
1
1
1
1
1
1
1
1
1
1
1
1
1
1
1
1
1
1
1
1
1
1
1
1
1
1
1
1
1
1
1
1
1
1
1
1
1
1
1
1
1
1
1
1
1
1
1
1
1
1
1
1
1
1
1
1
1
1
1
1
1
1
1
1
1
1
1
1
1
1
1
1
1
1
1
1
1
1
1
1
1
1
1
1
1
1
1
1
1
1
1
1
1
1
1
1
1
1
1
1
1
1
1
1
1
1
1
1
1
1
1
1
1
1
1
1
1
1
1
1
1
1
1
1
1
1
1
1
1
1
1
1
1
1
1
1
1
1
1
1
1
1
1
1
1
1
1
1
1
1
1
1
1
1
1
1
1
1
1
1
1
1
1
1
1
1
1
1
1
1
1
1
1
1
1
1
1
1
1
1
1
1
1
1
1
1
1
1
1
1
1
1
1
1
1
1
1
1
1
1
1
1
1
1
1
1
1
1
1
1
1
1
1
1
1
1
1
1
1
1
1
1
1
1
1
1
1
1
1
1
1
1
1
1
1
1
1
1
1
1
1
1
1
1
1
1
1
1
1
1
1
1
1
1
1
1
1
1
1
1
1
1
1
1
1
1
1
1
1
1
1
1
1
1
1
1
1
1
1
1
1
1
1
1
1
1
1
1
1
1
1
1
1
1
1
1
1
1
1
1
1
1
1
1
1
1
1
1
1
1
1
1
1
1
1
1
1
1
1
1
1
1
1
1
1
1
1
1
1
1
1
1
1
1
1
1
1
1
1
1
1
1
1
1
1
1
1
1
1
1
1
1
1
1
1
1
1
1
1
1
1
1
1
1
1
1
1
1
1
1
1
1
1
1
1
1
1
1
1
1
1
1
1
1
1
1
1
1
1
1
1
1
1
1
1
1
1
1
1
1
1
1
1
1
1
1
1
1
1
1
1
1
1
1
1
1
1
1
1
1
1
1
1
1
1
1
1
1
1
1
1
1
1
1
1
1
1
1
1
1
1
1
1
1
1
1
1
1
1
1
1
1
1
1
1
1
1
1
1
1
1
1
1
1
1
1
1
1
1
1
1
1
1
1
1
1
1
1
1
1
1
1
1
1
1
1
1
1
1
1
1
1
1
1
1
1
1
1
1
1
1
1
1
1
1
1
1
1
1
1
1
1
1
1
1
1
1
1
1
1
1
1
1
1
1
1
1
1
1
1
1
1
1
1
1
1
1
1
1
1
1
1
1
1
1
1
1
1
1
1
1
1
1
1
1
1
1
1
1
1
1
1
1
1
1
1
1
1
1
1
1
1
1
1
1
1
1
1
1
1
1
1
1
1
1
1
1
1
1
1
1
1
1
1
1
1
1
1
1
1
1
1
1
1
1
1
1
1
1
1
1
1
1
1
1
1
1
1
1
1
1
1
1
1
1
1
1
1
1
1
1
1
1
1
1
1
1
1
1
1
1
1
1
1
1
1
1
1
1
1
1
1
1
1
1
1
1
1
1
1
1
1
1
1
1
1
1
1
1
1
1
1
1
1
1
1
1
1
1
1
1
1
1
1
1
1
1
1
1
1
1
1
1
1
1
1
1
1
1
1
1
1
1
1
1
1
1
1
1
1
1
1
1
1
1
1
1
1
1
1
1
1
1
1
1
1
1
1
1
1
1
1
1
1
1
1
1
1
1
1
1
1
1
1
1
1
1
1
1
1
1
1
1
1
1
1
1
1
1
1
1
1
1
1
1
1
1
1
1
1
1
1
1
1
1
1
1
1
1
1
1
1
1
1
1
1
1
1
1
1
1
1
1
1
1
1
1
1
1
1
1
1
1
1
1
1
1
1
1
1
1
1
1
1
1
1
1
1
1
1
1
1
1
1
1
1
1
1
1
1
1
1
1
1
1
1
1
1
1
1
1
1
1
1
1
1
1
1
1
1
1
1
1
1
1
1
1
1
1
1
1
1
1
1
1
1
1
1
1
1
1
1
1
1
1
1
1
1
1
1
1
1
1
1
1
1
1
1
1
1
1
1
1
1
1
1
1
1
1
1
1
1
1
1
1
1
1
1
1
1
1
1
1
1
1
1
1
1
1
1
1
1
1
1
1
1
1
1
1
1
1
1
1
1
1
1
1
1
1
1
1
1
1
1
1
1
1
1
1
1
1
1
1
1
1
1
1
1
1
1
1
1
1
1
1
1
1
1
1
1
1
1
1
1
1
1
1
1
1
1
1
1
1
1
1
1
1
1
1
1
1
1
1
1
1
1
1
1
1
1
1
1
1
1
1
1
1
1
1
1
1
1
1
1
1
1
1
1
1
1
1
1
1
1
1
1
1
1
1
1
1
1
1
1
1
1
1
1
1
1
1
1
1
1
1
1
1
1
1
1
1
1
1
1
1
1
1
1
1
1
1
1
1
1
1
1
1
1
1
1
1
1
1
1
1
1
1
1
1
1
1
1
1
1
1
1
1
1
1
1
1
1
1
1
1
1
1
1
1
1
1
1
1
1
1
1
1
1
1
1
1
1
1
1
1
1
1
1
1
1
1
1
1
1
1
1
1
1
1
1
1
1
1
1
1
1
1
1
1
1
1
1
1
1
1
1
1
1
1
1
1
1
1
1
1
1
1
1
1
1
1
1
1
1
1
1
1
1
1
1
1
1
1
1
1
1
1
1
1
1
1
1
1
1
1
1
1
1
1
1
1
1
1
1
1
1
1
1
1
1
1
1
1
1
1
1
1
1
1
1
1
1
1
1
1
1
1
1
1
1
1
1
1
1
1
1
1
1
1
1
1
1
1
1
1
1
1
1
1
1
1
1
1
1
1
1
1
1
1
1
1
1
1
1
1
1
1
1
1
1
1
1
1
1
1
1
1
1
1
1
1
1
1
1
1
1
1
1
1
1
1
1
1
1
1
1
1
1
1
1
1
1
1
1
1
1
1
1
1
1
1
1
1
1
1
1
1
1
1
1
1
1
1
1
1
1
1
1
1
1
1
1
1
1
1
1
1
1
1
1
1
1
1
1
1
1
1
1
1
1
1
1
1
1
1
1
1
1
1
1
1
1
1
1
1
1
1
1
1
1
1
1
1
1
1
1
1
1
1
1
1
1
1
1
1
1
1
1
1
1
1
1
1
1
1
1
1
1
1
1
1
1
1
1
1
1
1
1
1
1
1
1
1
1
1
1
1
1
1
1
1
1
1
1
1
1
1
1
1
1
1
1
1
1
1
1
1
1
1
1
1
1
1
1
1
1
1
1
1
1
1
1
1
1
1
1
1
1
1
1
1
1
1
1
1
1
1
1
1
1
1
1
1
1
1
1
1
1
1
1
1
1
1
1
1
1
1
1
1
1
1
1
1
1
1
1
1
1
1
1
1
1
1
1
1
1
1
1
1
1
1
1
1
1
1
1
1
1
1
1
1
1
1
1
1
1
1
1
1
1
1
1
1
1
1
1
1
1
1
1
1
1
1
1
1
1
1
1
1
1
1
1
1
1
1
1
1
1
1
1
1
1
1
1
1
1
1
1
1
1
1
1
1
1
1
1
1
1
1
1
1
1
1
1
1
1
1
1
1
1
1
1
1
1
1
1
1
1
1
1
1
1
1
1
1
1
1
1
1
1
1
1
1
1
1
1
1
1
1
1
1
1
1
1
1
1
1
1
1
1
1
1
1
1
1
1
1
1
1
1
1
1
1
1
1
1
1
1
1
1
1
1
1
1
1
1
1
1
1
1
1
1
1
1
1
1
1
1
1
1
1
1
1
1
1
1
1
1
1
1
1
1
1
1
1
1
1
1
1
1
1
1
1
1
1
1
1
1
1
1
1
1
1
1
1
1
1
1
1
1
1
1
1
1
1
1
1
1
1
1
1
1
1
1
1
1
1
1
1
1
1
1
1
1
1
1
1
1
1
1
1
1
1
1
1
1
1
1
1
1
1
1
1
1
1
1
1
1
1
1
1
1
1
1
1
1
1
1
1
1
1
1
1
1
1
1
1
1
1
1
1
1
1
1
1
1
1
1
1
1
1
1
1
1
1
1
1
1
1
1
1
1
1
1
1
1
1
1
1
1
1
1
1
1
1
1
1
1
1
1
1
1
1
1
1
1
1
1
1
1
1
1
1
1
1
1
1
1
1
1
1
1
1
1
1
1
1
1
1
1
1
1
1
1
1
1
1
1
1
1
1
1
1
1
1
1
1
1
1
1
1
1
1
1
1
1
1
1
1
1
1
1
1
1
1
1
1
1
1
1
1
1
1
1
1
1
1
1
1
1
1
1
1
1
1
1
1
1
1
1
1
1
1
1
1
1
1
1
1
1
1
1
1
1
1
1
1
1
1
1
1
1
1
1
1
1
1
1
1
1
1
1
1
1
1
1
1
1
1
1
1
1
1
1
1
1
1
1
1
1
1
1
1
1
1
1
1
1
1
1
1
1
1
1
1
1
1
1
1
1
1
1
1
1
1
1
1
1
1
1
1
1
1
1
1
1
1
1
1
1
1
1
1
1
1
1
1
1
1
1
1
1
1
1
1
1
1
1
1
1
1
1
1
1
1
1
1
1
1
1
1
1
1
1
1
1
1
1
1
1
1
1
1
1
1
1
1
1
1
1
1
1
1
1
1
1
1
1
1
1
1
1
1
1
1
1
1
1
1
1
1
1
1
1
1
1
1
1
1
1
1
1
1
1
1
1
1
1
1
1
1
1
1
1
1
1
1
1
1
1
1
1
1
1
1
1
1
1
1
1
1
1
1
1
1
1
1
1
1
1
1
1
1
1
1
1
1
1
1
1
1
1
1
1
1
1
1
1
1
1
1
1
1
1
1
1
1
1
1
1
1
1
1
1
1
1
1
1
1
1
1
1
1
1
1
1
1
1
1
1
1
1
1
1
1
1
1
1
1
1
1
1
1
1
1
1
1
1
1
1
1
1
1
1
1
1
1
1
1
1
1
1
1
1
1
1
1
1
1
1
1
1
1
1
1
1
1
1
1
1
1
1
1
1
1
1
1
1
1
1
1
1
1
1
1
1
1
1
1
1
1
1
1
1
1
1
1
1
1
1
1
1
Publication Years
1476
3558
388
23
2
Category
2247
366
285
277
182
54
39
3
Toolboxes
515
384
379
279
265
213
155
150
122
120
115
111
90
86
84
80
76
60
19
18
18
16
8
4
3
1
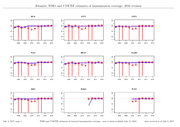
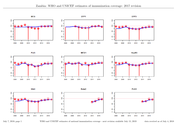
2016 revision
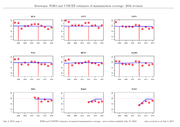
2016 revision
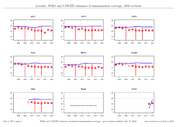
Data received as of July 3, 2017 | WHO and UNICEF estimates of national immunization coverage - next revision available July 15, 2018
This report investigates the impact of potential misclassification of samples on HIV prevalence estimates for 23 surveys conducted from 2010-2014. In addition to visual inspection of laboratory results, we examined how accounting for potential miscl
...
assification of HIV status through Bayesian latent class models affected the prevalence estimates. Two types of Bayesian models were specified: a model that only uses the individual dichotomous test results and a continuous model that uses the quantitative information of the EIA (i.e., the signal-to-cutoff values). Overall, we found that adjusted prevalence estimates matched the surveys’ original results, with overlapping uncertainty intervals. This suggested that misclassification of HIV status should not affect the prevalence estimates in most surveys. However, our analyses suggested that two surveys may be problematic. The prevalence could have been overestimated in the Uganda AIDS Indicator Survey 2011 and the Zambia Demographic and Health Survey 2013-14, although the magnitude of overestimation remains difficult to ascertain. Interpreting results from the Uganda survey is difficult because of the lack of internal quality control and potential violation of the multivariate normality assumption of the continuous Bayesian latent class model. In conclusion, despite the limitations of our latent class models, our analyses suggest that prevalence estimates from most of the surveys reviewed are not affected by sample misclassification.
more
Global and regional estimates of violence against women
he report presents the first global systematic review of scientific data on the prevalence of two forms of violence against women: violence by an intimate partner (intimate partner violence) a
...
nd sexual violence by someone other than a partner (non-partner sexual violence). It shows, for the first time, global and regional estimates of the prevalence of these two forms of violence, using data from around the world. Previous reporting on violence against women has not differentiated between partner and non-partner violence. You can download the report in different languages
more
Every day in 2020, approximately 800 women died from preventable causes related to pregnancy and childbirth - meaning that a woman dies around every two minutes.
Sustainable Development Goal (SDG) target 3.1 is to reduce maternal mortality to less than 70 maternal deaths per 100 000 live births by
...
2030.
The United Nations Maternal Mortality Estimation Inter-Agency Group (MMEIG) – comprising WHO, the United Nations Children’s Fund (UNICEF), the United Nations Population Fund (UNFPA), the World Bank Group and the United Nations Department of Economic and Social Affairs, Population Division (UNDESA/Population Division) has collaborated with external technical experts on a new round of estimates covering 2000 to 2020. The estimates represent the most up to date, internationally-comparable MMEIG estimates of maternal mortality, using refined input data and methods from previous rounds.
The report presents internationally comparable global, regional and country-level estimates and trends for maternal mortality between 2000 and 2020.
more
Working Paper 589 July 2021T
This report presents country, regional and global estimates of low birth weight for 2000, together with a detailed description of the methods used in calculating the estimates. Some limited data on
...
trends are also included. The limitations of low-birth-weight data are described and recommendations are made for further improvements in the data for this important indicator of health.
more
In this paper they make estimates of the potential short-term economic impact of COVID-19 on global monetary poverty through contractions in per capita household income or consumption.
The estimates
...
are based on three scenarios: low, medium, and high global contractions of 5, 10, and 20 per cent; we calculate the impact of each of these scenarios on the poverty headcount using the international poverty lines of US$1.90, US$3.20 and US$5.50 per day.
The estimates show that COVID poses a real challenge to the UN Sustainable Development Goal of ending poverty by 2030 because global poverty could increase for the first time since 1990 and, depending on the poverty line, such increase could represent a reversal of approximately a decade in the world’s progress in reducing poverty.
In some regions the adverse impacts could result in poverty levels similar to those recorded 30 years ago. Under the most extreme scenario of a 20 per cent income or consumption contraction, the number of people living in poverty could increase by 420–580 million, relative to the latest official recorded figures for 2018.
more
Improving UNAIDS’ paediatric and adolescent estimates
UNAIDS
(2019)
C2
Accessed: 20.10.2019
Key findings of the 2018 edition
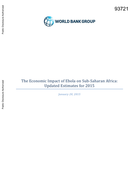
The Economic Impact of Ebola on Sub-Saharan Africa: Updated Estimates for 2015
The World Bank
(2015)
Most African Countries Avoid Major Economic Loss but Impact on Guinea, Liberia, Sierra Leone Remains Crippling

In the spirit of the Sustainable Development Goals, WHO and the International Labour Organization (ILO) produce the WHO/ILO Joint Estimates of the Work-related Burden of Disease and Injury (WHO/ILO Joint E
...
stimates). The WHO/ILO Joint Estimates quantify the population exposed to occupational risk factors and amount health loss caused by these exposures. Global, regional and national estimates are produced of the numbers of deaths and disability-adjusted life years that can be attributed to exposure to selected occupational risk factors. Estimates are produced disaggregated by sex and age group.
more
PLOS ONE | www.plosone.org
May 2013 | Volume 8 | Issue 5 | e63476
National estimates have been developed every two years since 2003, led by the NCASC with close collaboration from a range of technical experts, partners and epidemiologists from the UNAIDS, WHO and FHI. This contains information about estimations of
...
adult HIV prevalence.
more
The report summarizes the estimates of the burden of disease attributable to unsafe drinking water, sanitation, and hygiene for the year 2019 for four health outcomes - diarrhoea, acute respiratory infections, soil-transmitted helminthiases, and und
...
ernutrition - which are included in the reporting of the Sustainable Development Goal indicator 3.9.2. The report includes estimates at global, regional and country level for 183 WHO Member States.
more
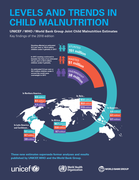
In 2014 UNICEF, WHO and the World Bank report new joint estimates of child malnutrition using available data up to 2013 The Interactive dashboard allows users to generate a variety of graphs and charts, using the newest joint
...
estimates of prevalence and numbers for child stunting, underweight, overweight, wasting and severe wasting. Users can select the different regional country groupings of the UN, MDG, UNICEF, WHO regions as well as World Bank income groups and geographic regions to present the data.
A summary of 4 pages presents the key findings for each indicator, an introduction to the dashboard and updates on methods
more

Background
Four methods have previously been used to track aid for reproductive, maternal, newborn, and child health (RMNCH). At a meeting of donors and stakeholders in May, 2018, a single, agreed method was requested to produce accurate, predictable, transparent, and up-to-date
...
estimates that could be used for analyses from both donor and recipient perspectives. Muskoka2 was developed to meet these needs. We describe Muskoka2 and present estimates of levels and trends in aid for RMNCH in 2002–17, with a focus on the latest estimates for 2017.
Methods
Muskoka2 is an automated algorithm that generates disaggregated estimates of aid for reproductive health, maternal and newborn health, and child health at the global, donor, and recipient-country levels. We applied Muskoka2 to the Organisation for Economic Co-operation and Development's Creditor Reporting System (CRS) aid activities database to generate estimates of RMNCH disbursements in 2002–17. The percentage of disbursements that benefit RMNCH was determined using CRS purpose codes for all donors except Gavi, the Vaccine Alliance; the UN Population Fund; and UNICEF; for which fixed percentages of aid were considered to benefit RMNCH. We analysed funding by donor for the 20 largest donors, by recipient-country income group, and by recipient for the 16 countries with the greatest RMNCH need, defined as the countries with the worst levels in 2015 on each of seven health indicators.
Findings
After 3 years of stagnation, reported aid for RMNCH reached $15·9 billion in 2017, the highest amount ever reported. Among donors reporting in both 2016 and 2017, aid increased by 10% ($1·4 billion) to $15·4 billion between 2016 and 2017. Child health received almost half of RMNCH disbursements in 2017 (46%, $7·4 billion), followed by reproductive health (34%, $5·4 billion), and maternal and newborn health (19%, $3·1 billion). The USA ($5·8 billion) and the UK ($1·6 billion) were the largest bilateral donors, disbursing 46% of all RMNCH funding in 2017 (including shares of their core contributions to multilaterals). The Global Fund and Gavi were the largest multilateral donors, disbursing $1·7 billion and $1·5 billion, respectively, for RMNCH from their core budgets. The proportion of aid for RMNCH received by low-income countries increased from 31% in 2002 to 52% in 2017. Nigeria received 7% ($1·1 billion) of all aid for RMNCH in 2017, followed by Ethiopia (6%, $876 million), Kenya (5%, $754 million), and Tanzania (5%, $751 million).
Interpretation
Muskoka2 retains the speed, transparency, and donor buy-in of the G8's previous Muskoka approach and incorporates eight innovations to improve precision. Although aid for RMNCH increased in 2017, low-income and middle-income countries still experience substantial funding gaps and threats to future funding. Maternal and newborn health receives considerably less funding than reproductive health or child health, which is a persistent issue requiring urgent attention.
Funding
Bill & Melinda Gates Foundation; Partnership for Maternal, Newborn & Child Health.
more