Filter
1177
Text search:
charts
Featured
113
353
Language
Document type
742
133
127
61
56
25
12
10
4
3
2
1
1
Countries
101
48
33
33
32
30
30
30
27
22
22
20
19
17
17
16
15
13
12
11
10
9
8
7
7
7
7
7
6
6
6
5
5
4
4
4
4
4
4
4
4
3
3
3
3
2
2
2
2
2
2
2
2
2
2
1
1
1
1
1
1
1
1
1
1
1
1
1
1
1
1
1
1
1
1
1
1
1
1
Authors & Publishers
Publication Years
Category
535
113
112
74
68
55
9
1
Toolboxes
67
65
65
52
45
36
32
32
30
27
23
20
20
17
14
12
10
9
8
7
4
4
1
1

There are two sets of charts. One set (14 charts) can be used in settings where blood cholesterol can be measured. The other set (14 charts) is for
...
Both Ukraine and Russia are some of the world’s largest food exporters. How could global food be impacted?

Agricultural productivity across Sub-Saharan Africa needs to improve to reduce hunger, poverty, and the destruction of biodiversity.
Ensuring healthy lives and promoting well-being for all is possible – but only if economically better-off and disadvantaged countries play their part
Cardiovascular disease is a major cause of disability and premature death throughout the world, and contributes substantially to the escalating costs of health care. The underlying pathology is atherosclerosis, which develops over many years and is usually advanced by the time symptoms occur, genera
...

To help adapt cardiovascular disease risk prediction approaches to low-income and middle-income countries, WHO has convened an effort to develop, evaluate, and illustrate revised risk models. Here, we report the derivation, validation, and illustration of the revised WHO cardiovascular disease risk
...
Prevention Of Cardiovascular Disease: Guidelines For Assessment And Management Or Cardiocascular Risk
recommended
This publication provides guidance on reducing disability and premature deaths from coronary heart disease, cerebrovascular disease and peripheral vascular disease in people at high risk, who have not yet experienced a cardiovascular event.

The article "Cardiovascular Diseases" on Our World in Data provides an in-depth analysis of cardiovascular diseases (CVD), the leading cause of death globally. It examines CVD trends, such as the decline in mortality rates in high-income countries due to improved healthcare and lifestyle changes, wh
...
The IMCI model handbook provides a detailed explanation of the IMCI case management guidelines. It is organized into seven main parts: overview of the IMCI process; assess and classify the sick child age 2 months up to 5 years; assess and classify the sick young infant age 1 week up to 2 months; ide
...
Prevention of Cardiovascular Disease. Pocket Guidelines for Assessment and Management of Cardiovascular Risk
recommended
These pocket guidelines provide evidence-based guidance on how to reduce the incidence of first and recurrent clinical events due to coronary heart disease (CHD), cerebrovascular disease (CeVD) and peripheral vascular disease in two categories of people
The community-BFCI (c-BFCI) manual has been developed to facilitate training of CHVs and stakeholders providing nutrition sensitive services at community level. The manual covers a wide range of topics: basic nutrition, exclusive breastfeeding, complementary feeding, Breast Milk Substitutes Act, gro
...

The IMCI chart booklet is for use by doctors, nurses and other health professionals who see young infants and children less than five years old. It facilitates the use of the IMCI case management process in practice and describes a series of all the case management steps in a form of IMCI
...
Here you can download different charts about cases by world region, prevalence rates, and progress towards polio eradication and much more.
Polio is an infectious disease that is caused and transmitted by the poliovirus. Most infections do not le
...
War in Ukraine
recommended
On this page we provide a list of charts, data and resources that you may find useful to understand the context of the ongoing war in Ukraine.
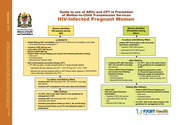
The main aim of these guidelines is to enable the central units of national TB and HIV/AIDS programmes to support districts to plan, coordinate and implement collaborative TB/HIV activities. These guidelines reinforce current medical understanding, that highly active antiretroviral treatment (HAART)
...