Filter
4865
Text search:
statistics
Featured
204
1590
Language
4474
159
149
87
34
32
31
28
14
13
5
4
4
4
3
3
3
2
2
2
2
2
2
2
2
1
1
1
1
1
1
1
1
1
1
1
1
1
1
1
1
1
1
1
1
1
1
Document type
3193
799
200
168
115
107
104
83
45
31
8
4
3
Countries
183
149
148
147
141
133
124
123
117
106
104
101
98
95
94
93
88
83
82
71
69
68
67
67
66
64
62
58
56
54
53
50
49
44
43
39
38
29
28
28
27
26
26
25
22
22
22
21
19
19
18
18
18
17
17
15
15
14
14
13
13
13
12
12
11
11
11
10
10
9
9
9
9
8
8
8
7
7
7
7
6
6
5
5
4
4
4
4
4
4
4
4
4
4
4
3
3
3
3
3
3
3
3
3
3
3
3
2
2
2
2
2
2
2
2
2
2
2
2
2
2
2
1
1
1
1
1
1
1
1
1
1
1
1
1
1
1
1
1
1
1
1
1
1
1
1
1
Authors & Publishers
401
303
186
180
119
112
105
67
64
45
34
29
26
25
25
23
23
23
21
19
19
18
18
18
17
16
16
16
15
15
14
14
14
14
14
13
13
13
13
13
13
12
12
12
12
12
12
11
11
11
11
11
10
10
10
10
10
10
10
9
9
9
9
9
9
9
9
9
8
8
8
8
8
8
8
8
8
8
8
8
8
8
8
7
7
7
7
7
7
7
7
7
7
7
7
7
6
6
6
6
6
6
6
6
6
6
6
6
6
6
6
6
6
6
6
6
6
6
5
5
5
5
5
5
5
5
5
5
5
5
5
5
5
5
5
5
5
5
5
5
5
5
5
5
5
5
4
4
4
4
4
4
4
4
4
4
4
4
4
4
4
4
4
4
4
4
4
4
4
4
4
4
4
4
4
4
4
4
4
4
4
4
4
4
4
4
4
4
4
4
4
4
4
4
3
3
3
3
3
3
3
3
3
3
3
3
3
3
3
3
3
3
3
3
3
3
3
3
3
3
3
3
3
3
3
3
3
3
3
3
3
3
3
3
3
3
3
3
3
3
3
3
3
3
3
3
3
3
3
3
3
3
3
3
3
3
3
3
3
3
3
3
3
3
3
3
3
3
3
3
3
3
3
3
3
3
3
3
3
3
3
3
3
3
3
3
3
3
3
3
3
3
3
3
3
3
3
3
3
3
3
3
3
2
2
2
2
2
2
2
2
2
2
2
2
2
2
2
2
2
2
2
2
2
2
2
2
2
2
2
2
2
2
2
2
2
2
2
2
2
2
2
2
2
2
2
2
2
2
2
2
2
2
2
2
2
2
2
2
2
2
2
2
2
2
2
2
2
2
2
2
2
2
2
2
2
2
2
2
2
2
2
2
2
2
2
2
2
2
2
2
2
2
2
2
2
2
2
2
2
2
2
2
2
2
2
2
2
2
2
2
2
2
2
2
2
2
2
2
2
2
2
2
2
2
2
2
2
2
2
2
2
2
2
2
2
2
2
2
2
2
2
2
2
2
2
2
2
2
2
2
2
2
2
2
2
2
2
2
2
2
2
2
2
2
2
2
2
2
2
2
2
2
2
2
2
2
2
2
2
2
2
2
2
2
2
2
2
2
2
2
2
2
2
2
2
2
2
2
2
2
2
2
2
2
2
2
2
2
2
2
2
2
2
2
2
2
2
2
2
2
2
2
2
2
2
2
2
2
2
2
2
2
2
2
2
2
2
2
2
2
2
2
2
2
2
2
2
2
2
2
2
2
2
2
2
2
2
2
2
2
2
2
2
2
2
2
2
2
2
2
2
2
2
2
2
2
2
2
2
2
2
2
2
2
2
2
2
2
2
2
2
2
2
2
1
1
1
1
1
1
1
1
1
1
1
1
1
1
1
1
1
1
1
1
1
1
1
1
1
1
1
1
1
1
1
1
1
1
1
1
1
1
1
1
1
1
1
1
1
1
1
1
1
1
1
1
1
1
1
1
1
1
1
1
1
1
1
1
1
1
1
1
1
1
1
1
1
1
1
1
1
1
1
1
1
1
1
1
1
1
1
1
1
1
1
1
1
1
1
1
1
1
1
1
1
1
1
1
1
1
1
1
1
1
1
1
1
1
1
1
1
1
1
1
1
1
1
1
1
1
1
1
1
1
1
1
1
1
1
1
1
1
1
1
1
1
1
1
1
1
1
1
1
1
1
1
1
1
1
1
1
1
1
1
1
1
1
1
1
1
1
1
1
1
1
1
1
1
1
1
1
1
1
1
1
1
1
1
1
1
1
1
1
1
1
1
1
1
1
1
1
1
1
1
1
1
1
1
1
1
1
1
1
1
1
1
1
1
1
1
1
1
1
1
1
1
1
1
1
1
1
1
1
1
1
1
1
1
1
1
1
1
1
1
1
1
1
1
1
1
1
1
1
1
1
1
1
1
1
1
1
1
1
1
1
1
1
1
1
1
1
1
1
1
1
1
1
1
1
1
1
1
1
1
1
1
1
1
1
1
1
1
1
1
1
1
1
1
1
1
1
1
1
1
1
1
1
1
1
1
1
1
1
1
1
1
1
1
1
1
1
1
1
1
1
1
1
1
1
1
1
1
1
1
1
1
1
1
1
1
1
1
1
1
1
1
1
1
1
1
1
1
1
1
1
1
1
1
1
1
1
1
1
1
1
1
1
1
1
1
1
1
1
1
1
1
1
1
1
1
1
1
1
1
1
1
1
1
1
1
1
1
1
1
1
1
1
1
1
1
1
1
1
1
1
1
1
1
1
1
1
1
1
1
1
1
1
1
1
1
1
1
1
1
1
1
1
1
1
1
1
1
1
1
1
1
1
1
1
1
1
1
1
1
1
1
1
1
1
1
1
1
1
1
1
1
1
1
1
1
1
1
1
1
1
1
1
1
1
1
1
1
1
1
1
1
1
1
1
1
1
1
1
1
1
1
1
1
1
1
1
1
1
1
1
1
1
1
1
1
1
1
1
1
1
1
1
1
1
1
1
1
1
1
1
1
1
1
1
1
1
1
1
1
1
1
1
1
1
1
1
1
1
1
1
1
1
1
1
1
1
1
1
1
1
1
1
1
1
1
1
1
1
1
1
1
1
1
1
1
1
1
1
1
1
1
1
1
1
1
1
1
1
1
1
1
1
1
1
1
1
1
1
1
1
1
1
1
1
1
1
1
1
1
1
1
1
1
1
1
1
1
1
1
1
1
1
1
1
1
1
1
1
1
1
1
1
1
1
1
1
1
1
1
1
1
1
1
1
1
1
1
1
1
1
1
1
1
1
1
1
1
1
1
1
1
1
1
1
1
1
1
1
1
1
1
1
1
1
1
1
1
1
1
1
1
1
1
1
1
1
1
1
1
1
1
1
1
1
1
1
1
1
1
1
1
1
1
1
1
1
1
1
1
1
1
1
1
1
1
1
1
1
1
1
1
1
1
1
1
1
1
1
1
1
1
1
1
1
1
1
1
1
1
1
1
1
1
1
1
1
1
1
1
1
1
1
1
1
1
1
1
1
1
1
1
1
1
1
1
1
1
1
1
1
1
1
1
1
1
1
1
1
1
1
1
1
1
1
1
1
1
1
1
1
1
1
1
1
1
1
1
1
1
1
1
1
1
1
1
1
1
1
1
1
1
1
1
1
1
1
1
1
1
1
1
1
1
1
1
1
1
1
1
1
1
1
1
1
1
1
1
1
1
1
1
1
1
1
1
1
1
1
1
1
1
1
1
1
1
1
1
1
1
1
1
1
1
1
1
1
1
1
1
1
1
1
1
1
1
1
1
1
1
1
1
1
1
1
1
1
1
1
1
1
1
1
1
1
1
1
1
1
1
1
1
1
1
1
1
1
1
1
1
1
1
1
1
1
1
1
1
1
1
1
1
1
1
1
1
1
1
1
1
1
1
1
1
1
1
1
1
1
1
1
1
1
1
1
1
1
1
1
1
1
1
1
1
1
1
1
1
1
1
1
1
1
1
1
1
1
1
1
1
1
1
1
1
1
1
1
1
1
1
1
1
1
1
1
1
1
1
1
1
1
1
1
1
1
1
1
1
1
1
1
1
1
1
1
1
1
1
1
1
1
1
1
1
1
1
1
1
1
1
1
1
1
1
1
1
1
1
1
1
1
1
1
1
1
1
1
1
1
1
1
1
1
1
1
1
1
1
1
1
1
1
1
1
1
1
1
1
1
1
1
1
1
1
1
1
1
1
1
1
1
1
1
1
1
1
1
1
1
1
1
1
1
1
1
1
1
1
1
1
1
1
1
1
1
1
1
1
1
1
1
1
1
1
1
1
1
1
1
1
1
1
1
1
1
1
1
1
1
1
1
1
1
1
1
1
1
1
1
1
1
1
1
1
1
1
1
1
1
1
1
1
1
1
1
1
1
1
1
1
1
1
1
1
1
1
1
1
1
1
1
1
1
1
1
1
1
1
1
1
1
1
1
1
1
1
1
1
1
1
1
1
1
1
1
1
1
1
1
1
1
1
1
1
1
1
1
1
1
1
1
1
1
1
1
1
1
1
1
1
1
1
1
1
1
1
1
1
1
1
1
1
1
1
1
1
1
1
1
1
1
1
1
1
1
1
1
1
1
1
1
1
1
1
1
1
1
1
1
1
1
1
1
1
1
1
1
1
1
1
1
1
1
1
1
1
1
1
1
1
1
1
1
1
1
1
1
1
1
1
1
1
1
1
1
1
1
1
1
1
1
1
1
1
1
1
1
1
1
1
1
1
1
1
1
1
1
1
1
1
1
1
1
1
1
1
1
1
1
1
1
1
1
1
1
1
1
1
1
1
1
1
1
1
1
1
1
1
1
1
1
1
1
1
1
1
1
1
1
1
1
1
1
1
1
1
1
1
1
1
1
1
1
1
1
1
1
1
1
1
1
1
1
1
1
1
1
1
1
1
1
1
1
1
1
1
1
1
1
1
1
1
1
1
1
1
1
1
1
1
1
1
1
1
1
1
1
1
1
1
1
1
1
1
1
1
1
1
1
1
1
1
1
1
1
1
1
1
1
1
1
1
1
1
1
1
1
1
1
1
1
1
1
1
1
1
1
1
1
1
1
1
1
1
1
1
1
1
1
1
1
1
1
1
1
1
1
1
1
1
1
1
1
1
1
1
1
1
1
1
1
1
1
1
1
1
1
1
1
1
1
1
1
1
1
1
1
1
1
1
1
1
1
1
1
1
1
1
1
1
1
1
1
1
1
1
1
1
1
1
1
1
1
1
1
1
1
1
1
1
1
1
1
1
1
1
1
1
1
1
1
1
1
1
1
1
1
1
1
1
1
1
1
1
1
1
1
1
1
1
1
1
1
1
1
1
1
1
1
1
1
1
1
1
1
1
1
1
1
1
1
1
1
1
1
1
1
1
1
1
1
1
1
1
1
1
1
1
1
1
1
1
1
1
1
1
1
1
1
1
1
1
1
1
1
1
1
1
1
1
1
1
1
1
1
1
1
1
1
1
1
1
1
1
1
1
1
1
1
1
1
1
1
1
1
1
1
1
1
1
1
1
1
1
1
1
1
1
1
1
1
1
1
1
1
1
1
1
1
1
1
1
1
1
1
1
1
1
1
1
1
1
1
1
1
1
1
1
1
1
1
1
1
1
1
1
1
1
1
1
1
1
1
1
1
1
1
1
1
1
1
1
1
1
1
1
1
1
1
1
1
1
1
1
1
1
1
1
1
1
1
1
1
1
1
1
1
1
1
1
1
1
1
1
1
1
1
1
1
1
1
1
1
1
1
1
1
1
1
1
1
1
1
1
1
1
1
1
1
1
1
1
1
1
1
1
1
1
1
1
1
1
1
1
1
1
1
1
1
1
1
1
1
1
1
1
1
1
1
1
1
1
1
1
1
1
1
1
1
1
1
1
1
1
1
1
1
1
1
1
1
1
1
1
1
1
1
1
1
1
1
1
1
1
1
1
1
1
1
1
1
1
1
1
1
1
1
1
1
1
1
1
1
1
1
1
1
1
1
1
1
1
1
1
1
1
1
1
1
1
1
1
1
1
1
1
1
1
1
1
1
1
1
1
1
1
1
1
1
1
1
1
1
1
1
1
1
1
1
1
1
1
1
1
1
1
1
1
1
1
1
1
1
1
1
1
1
1
1
1
1
1
1
1
1
1
1
1
1
1
1
1
1
1
1
1
1
1
1
1
1
1
1
1
1
1
1
1
1
1
1
1
1
1
1
1
1
1
1
1
1
1
1
1
1
1
1
1
1
1
1
1
1
1
1
1
1
1
1
1
1
1
1
1
1
1
1
1
1
1
1
1
1
1
1
1
1
1
1
1
1
1
1
1
1
1
1
1
1
1
1
1
1
1
1
1
1
1
1
1
1
1
1
1
1
1
1
1
1
1
1
1
1
1
1
1
1
1
1
1
1
1
1
1
1
1
1
1
1
1
1
1
1
1
1
1
1
1
1
1
1
1
1
1
1
1
1
1
1
1
1
1
1
1
1
1
1
1
1
1
1
1
1
1
1
1
1
1
1
1
1
1
1
1
1
1
1
1
1
1
1
1
1
1
1
1
1
1
1
1
1
1
1
1
1
1
1
1
1
1
1
1
1
1
1
1
1
1
1
1
1
1
1
1
1
1
1
1
1
1
1
1
1
1
1
1
1
1
1
1
1
1
1
1
1
1
1
1
1
1
1
1
1
1
1
1
1
1
1
1
1
1
1
1
1
1
1
1
1
1
1
1
1
1
1
1
1
1
1
1
1
1
1
1
1
1
1
1
1
1
1
1
1
1
1
1
1
1
1
1
1
1
1
1
1
1
1
1
1
1
1
1
1
1
1
1
1
1
1
1
1
1
1
1
1
1
1
1
1
1
1
1
1
1
1
1
1
1
1
1
1
1
1
1
1
1
1
1
1
1
1
1
1
1
1
1
1
1
1
1
1
1
1
1
1
1
1
1
1
1
1
1
1
1
1
1
1
1
1
1
1
1
1
1
1
1
1
1
1
1
1
1
1
1
1
1
1
1
1
1
1
1
1
1
1
1
1
1
1
1
1
1
1
1
1
1
1
1
1
1
1
1
1
1
1
1
1
1
1
1
1
1
1
1
1
1
1
1
1
1
1
1
1
1
1
1
1
1
1
1
1
1
1
1
1
1
1
1
1
1
1
1
1
1
1
1
1
1
1
1
1
1
1
1
1
1
1
1
1
1
1
1
1
1
1
1
1
1
1
1
1
1
1
1
1
1
1
1
1
1
1
1
1
1
1
1
1
1
1
1
1
1
1
1
1
1
1
1
1
1
1
1
1
1
1
1
1
1
1
1
1
1
1
1
1
1
1
1
1
1
1
1
1
1
1
1
1
1
1
1
1
1
1
1
1
1
1
1
1
1
1
1
1
1
1
1
1
1
1
1
1
1
1
1
1
1
1
1
1
1
1
1
1
1
1
1
1
1
1
1
1
1
1
1
1
1
1
1
1
1
1
1
1
1
1
1
1
1
1
1
1
1
1
1
1
1
1
1
1
1
1
1
1
1
1
1
1
1
1
1
1
1
1
1
1
1
1
1
1
1
1
1
1
1
1
1
1
1
1
1
1
1
1
1
1
1
1
1
1
1
1
1
1
1
1
1
1
1
1
1
1
1
1
1
1
1
1
1
1
1
1
1
1
1
1
1
1
1
1
1
1
1
1
1
1
1
1
1
1
1
1
1
1
1
1
1
1
1
1
1
1
1
1
1
1
1
1
1
1
1
1
1
1
1
1
1
1
1
1
1
1
1
1
1
1
1
1
1
1
1
1
1
1
1
1
1
1
1
1
1
1
1
1
1
1
1
1
1
1
1
1
1
1
1
1
1
1
1
1
1
1
1
1
1
1
1
1
1
1
1
1
1
1
1
1
1
1
1
1
1
1
1
1
1
1
1
1
1
1
1
1
1
1
1
1
1
1
1
1
1
1
1
1
1
1
1
1
1
1
1
1
1
1
1
1
1
1
1
1
1
1
1
1
1
1
1
1
1
1
1
1
1
1
1
1
1
1
1
1
1
1
1
1
1
1
1
1
1
1
1
1
1
1
1
1
1
1
1
1
1
1
1
1
1
1
1
1
1
1
1
1
1
1
1
1
1
1
1
1
1
1
1
1
1
1
1
1
1
1
1
1
1
1
1
1
1
1
1
1
1
1
1
1
1
1
1
1
1
1
1
1
1
1
1
1
1
1
1
1
1
1
1
1
1
1
1
1
1
1
1
1
1
1
1
1
1
1
1
1
1
1
1
1
1
1
1
1
1
1
1
1
1
1
1
1
1
1
1
1
1
1
1
1
1
1
1
1
1
1
1
1
1
1
1
1
1
1
1
1
1
1
1
1
1
1
1
1
1
1
1
1
1
1
1
1
1
1
1
1
1
1
1
1
1
1
1
1
1
1
1
1
1
1
1
1
1
1
1
1
1
1
1
1
1
1
1
1
1
1
1
1
1
1
1
1
1
1
1
1
1
1
1
1
1
1
1
1
1
1
1
1
1
1
1
1
1
1
1
1
1
1
1
1
1
1
1
1
1
1
1
1
1
1
1
1
1
1
1
1
1
1
1
1
1
1
1
1
1
1
1
1
1
1
1
1
1
1
1
1
1
1
1
1
1
1
1
1
1
1
1
1
1
1
1
1
1
1
1
1
1
1
1
1
1
1
1
1
1
1
1
1
1
1
1
1
1
1
1
1
1
1
1
1
1
1
1
1
1
1
1
1
1
1
1
1
1
1
1
1
1
1
1
1
1
1
1
1
1
1
1
1
1
1
1
1
1
1
1
1
1
1
1
1
1
1
1
1
1
1
1
1
1
1
1
1
1
1
1
1
1
1
1
1
1
1
1
1
1
1
1
1
1
1
1
1
1
1
1
1
1
1
1
1
1
1
1
1
1
1
1
1
1
1
1
1
1
1
1
1
1
1
1
1
1
1
1
1
1
1
1
1
1
1
1
1
1
1
1
1
1
1
1
1
1
1
1
1
1
1
1
1
1
1
1
1
1
1
1
1
1
1
1
1
1
1
1
1
1
1
1
1
1
1
1
1
1
1
1
1
1
1
1
1
1
1
1
1
1
1
1
1
1
1
1
1
1
1
1
1
1
1
1
1
1
1
1
1
1
1
1
1
1
1
1
1
1
1
1
1
1
1
1
1
1
1
1
1
1
1
1
1
1
1
1
1
1
1
1
1
1
1
1
1
1
1
1
1
1
1
1
1
1
1
1
1
1
1
1
1
1
1
1
1
1
1
1
1
1
1
1
1
1
1
1
1
1
1
1
1
1
1
1
1
1
1
1
1
1
1
1
1
1
1
1
1
1
1
1
1
1
1
1
1
1
1
1
1
1
1
1
1
1
1
1
1
1
1
1
1
1
1
1
1
1
1
1
1
1
1
1
1
1
1
1
1
1
1
1
1
1
1
1
1
1
1
1
1
1
1
1
1
1
1
1
1
1
1
1
1
1
1
1
1
1
1
1
1
1
1
1
1
1
1
1
1
1
1
1
1
1
1
1
1
1
1
1
1
1
1
1
1
1
1
1
1
1
1
1
1
1
1
1
1
1
1
1
1
1
Publication Years
1
1104
3375
370
12
2
1
Category
2887
198
184
122
115
57
15
4
Toolboxes
294
263
248
236
227
146
125
96
93
79
78
70
61
60
52
46
43
36
15
12
11
9
8
4
2
1
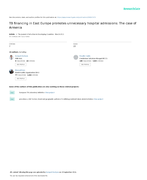
The Journal of Infection in Developing Countries 7(3):289-292
This report presents the findings of the Estimating the Size of Populations through a Household Survey (ESPHS) study that took place in 2011. The study utilized a single household survey to estimate the size of several key populations, including sex workers, men who have sex with men (MSM), injectin
...
g drug users (IDU), and clients of sex workers. These populations include several groups outlined in the National Strategic Plan for HIV and AIDS as most at risk for HIV infection, specifically sex workers and MSM.
more
DHS Further Analysis Reports No. 109 - This report documents trends in key child nutrition indicators in Rwanda. Data from the Demographic and Health Surveys (DHS) in 2005, 2010, and 2014-15 were analyzed, disaggregated by selected equity-related variables, and tested for trends. Over the survey per
...
iod, Rwanda had high rates of exclusive breastfeeding, with regional variation. Rates of continued breastfeeding were also high but generally decreased as mother’s education and household wealth increased in all survey years. Complementary feeding practices varied by region, mother’s education, household wealth, urban-rural residence, and sex of the child.
more
DHS Further Analysis Reports No. 108 - This report examines levels, trends, and inequalities in maternal health in Rwanda from 2010 to 2014-15 among women age 15-49 with a recent birth. The analysis uses Demographic and Health Survey (DHS) data for 15 key indicators of maternal health: 6 for antenat
...
al care, 3 for delivery, 1 for postnatal care, and 5 for barriers to accessing medical care. Levels and trends in these indicators were analyzed overall and by three background characteristics: women’s education, household wealth quintile, and region.
more
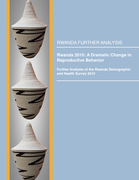
Rwanda 2010: A Dramatic Change in Reproductive Behavior
Westoff, C.F., F. Ngabo, C. Munyanshongore, M.A. Umubyeyi, and E. Kagame
Calverton, Maryland, USA: ICF International.
(2013)
C2
DHS Further Analysis Reports No. 90 - In Rwanda, between 2005 and 2010, there have been radical declines in the desired number of children, actual fertility, and child mortality along with a large increase in contraceptive prevalence. This study reviews trends in some of these measures. Multivariate
...
analyses evaluate the relative importance for
the desired number of children of years of schooling, wealth, urban residence, media exposure, child mortality, and attitudes toward gender equality. Variations in reproductive preferences, the total fertility rate, and unmet need for family planning are mapped for the 30 districts of Rwanda. The explanations for the rapid changes in reproductive attitudes and behavior are clearly related to the concerns of the country, the rapid rate of population growth, and its implications for economic development and reproductive health.
more

Recent Trends in HIV-Related Knowledge and Behaviors in Rwanda, 2005-2010: Further Analysis of the Demographic and Health Surveys.
Hong, Rathavuth, Jean de Dieu, Jeanine Umutesi Condo, Muhayimpundu Ribakare, and Egidie Murekatete
Calverton, Maryland, USA: ICF International
(2013)
C2
DHS Further Analysis Reports No. 89 - The 2010 Rwanda Demographic and Health Survey shows that 3 percent of Rwandan adults age 15-49 have been infected with HIV. The prevalence was much higher in urban areas, among women, and among adults who had multiple lifetime sexual partners and used a condom a
...
t last sexual intercourse. The
level of and differences in HIV prevalence in Rwanda in 2010 are very similar to those observed in 2005. Using data from the two recent Rwanda Demographic and Health Surveys, implemented in 2005 and
2010, this study examined changes in key HIV-related knowledge, attitudes, and sexual behavior indicators. Significant changes in selected indicators during 2005 and 2010 were determined by Student ttest with p-values less than 0.05.
more

Trends in Neonatal Mortality in Rwanda, 2000-2010
Winter, Rebecca, Thomas Pullum, Anne Langston, Ndicunguye V. Mivumbi, Pierre C. Rutayisire, Dieudonne N. Muhoza, and Solange Hakiba
Calverton, Maryland, USA: ICF International.
(2013)
C2
DHS Further Analysis Reports No. 88 - This further analysis examines levels, trends, and determinants of neonatal mortality in Rwanda, using data from the 2000, 2005, and 2010 Rwanda Demographic and Health Surveys (RDHS).

Measuring the Success of Family Planning Initiatives in Rwanda: A Multivariate Decomposition Analysis.
uhoza, Dieudonné Ndaruhuye, Pierre Claver Rutayisire, and Aline Umubyeyi.
Calverton, Maryland, USA: ICF International
(2013)
C2
DHS Working Papers No. 94 - This study described the family planning initiatives in Rwanda and analyzed the 2005 and 2010 RDHS data to identify factors that contribute to the increase in contraceptive use. The Blinder-Oaxaca technique was used to decompose the contributions of women’s characterist
...
ics and their effects.
more
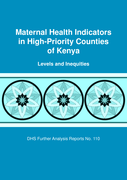
Levels and Inequities
DHS Further Analysis Reports No. 110
This study shows large variations in maternal health indicators across high-priority counties in Kenya. Nairobi exceeds the national average on all maternal health indicators in this study, while other highpriority counties consist ... ently are disadvantaged compared with Kenya as a whole in most maternal health indicators. Kisumu exceeds the national average in use of antenatal care, delivery in a health facility, and postnatal care, but not other indicators. Nakuru has fewer women with fertility risk and fewer women who report that the distance they must travel to reach a health facility is a problem.
This study identifies a number of inequities in maternal health indicators across socio-demographic characteristics in the high-priority counties—most in the distribution of delivery care and least in antenatal care. Inequities are also observed in fertility risk and postnatal care. more
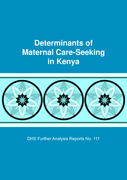
DHS Further Analysis Reports No. 111
This study is a theory-driven analysis of the socio-demographic determinants of maternal care seeking in Kenya. Specifically, it examines predisposing, enabling, and need factors potentially associated with use of antenatal care (ANC), health facility delive ... ry, and timely postnatal care (PNC).
This study uses data from the 2014 Kenya Demographic and Health Survey (KDHS) conducted among women age 15-49 with a live birth in the five years preceding the survey. It includes data from all 47 counties of Kenya, grouped contiguously into 12 regions. We apply Andersen’s Behavioral Model of Health Services Use to examine socio-demographic predictors of health service use. We estimate logistic regression models for adequate use of ANC (defined as attending at least four ANC visits, starting in the first three months of pregnancy), delivery in a health facility, and PNC within 48 hours of delivery. more
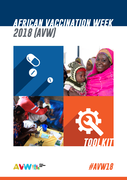
you can find branded materials including immunization backgrounders, posters, social media posts and more to amplify your existing activities and facilitate any communications for the week. Please feel free to tailor and adapt materials to meet specific country
Country Progress Report January 2008 - December 2009

It is the policy of the GoR to ensure that children’s rights are met through the provision of basic needs and services for all children in the country, and protect them from abuse and exploitation. Children are defined as persons below the age of 18 years and the ICRP covers children from the time
...
before their birth until they complete the age of 18 years. The Integrated Child Rights Policy of Rwanda is based on seven key themes: Identity and Nationality; Family and Alternative Care; Survival, Health and Standards of Living; Education; Protection; Justice; and Child Participation.
more

No publication date indicated.
Identifying characteristics associated with performing recommended practices in maternal and newborn care among health facilities in Rwanda: a cross-sectional study
Sipsma, H.L., Curry, L.A., Kakoma, J.P., Linnander, E.L., & Bradley, E.H.
Human Resources for Health
(2012)
CC
This study examined the quality of facility-based maternal and newborn health care by describing the implementation of recommended practices for maternal and newborn care among health care facilities to determine whether increased training, supervision, and incentives for health workers were associa
...
ted with implementing these recommended practices.
more
Inclusive Project Cycle Management
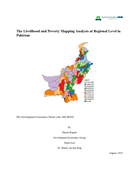
An attempt has been made to map the incidence of uni-dimensional and multi-dimensional poverty simultaneously arguably for the first time in Pakistan. While multi-dimensional poverty map is calculated using PSLM 2010-11; small area estimation technique is utilized to map uni-dimensional poverty usin
...
g both nationally representative HIES (Household Integrated Economic Survey) and district-level representative PSLM (Pakistan Standard of Living Measurement) for the same year of 2010-11. The result indicates the existence of spatial distribution of poverty pockets in each of the four provinces of Pakistan. Furthermore, it is also observed that these pockets of poverty are more concentrated in the desert and mountains regions of the country.
more
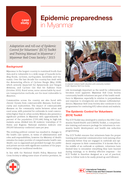
Adaptation and roll-out of Epidemic Control for Volunteers’ (ECV) Toolkit and Training Manual in Myanmar
The ECV Toolkit ensures that volunteers have the proper training and essential communication tools (among other materials) before they are engaged in outbreak and epidemic response in thei ... r communities. It is known that in the middle of an outbreak or epidemic, volunteers have limited time to remember everything they have learned during trainings, or to develop effective response – the ECV Toolkit is therefore designed as a set of practical, easy-to-follow tools to be easily picked up and followed. more
The ECV Toolkit ensures that volunteers have the proper training and essential communication tools (among other materials) before they are engaged in outbreak and epidemic response in thei ... r communities. It is known that in the middle of an outbreak or epidemic, volunteers have limited time to remember everything they have learned during trainings, or to develop effective response – the ECV Toolkit is therefore designed as a set of practical, easy-to-follow tools to be easily picked up and followed. more