Filter
2823
Text search:
Disability
Assessment
Featured
276
694
Language
2742
63
55
54
30
19
18
12
11
7
6
5
5
5
4
4
4
4
4
4
4
4
4
3
3
3
3
3
3
3
3
3
2
2
2
2
2
2
2
2
2
2
2
2
2
1
1
1
1
1
1
1
1
1
1
Document type
1756
410
287
164
118
40
19
18
6
2
2
1
Countries
142
127
69
63
60
56
52
52
48
48
46
43
41
40
39
35
33
32
29
29
27
27
23
22
22
21
20
19
19
16
14
14
13
13
13
12
11
11
10
10
8
8
8
8
7
7
7
7
7
7
7
7
6
6
6
6
5
5
5
5
5
5
5
4
4
4
4
4
3
3
3
3
3
3
2
2
2
2
2
2
2
2
2
2
2
2
2
2
2
2
2
2
2
2
1
1
1
1
1
1
1
1
1
1
1
1
1
1
1
1
1
1
1
1
1
1
1
1
1
1
1
1
1
1
Authors & Publishers
380
158
108
102
90
77
61
40
36
30
22
22
22
18
16
14
13
13
12
12
12
12
12
11
11
10
10
10
10
10
10
9
9
9
9
9
8
8
8
8
8
8
8
7
7
7
7
7
7
7
7
7
7
6
6
6
6
6
6
6
6
6
6
6
6
6
6
6
6
6
6
5
5
5
5
5
5
5
5
5
5
5
5
5
5
5
5
5
4
4
4
4
4
4
4
4
4
4
4
4
4
4
4
4
4
4
4
4
4
4
4
4
4
4
4
4
4
4
4
4
3
3
3
3
3
3
3
3
3
3
3
3
3
3
3
3
3
3
3
3
3
3
3
3
3
3
3
3
3
3
3
3
3
3
3
3
3
3
3
3
3
3
3
3
3
3
3
3
3
3
3
3
3
2
2
2
2
2
2
2
2
2
2
2
2
2
2
2
2
2
2
2
2
2
2
2
2
2
2
2
2
2
2
2
2
2
2
2
2
2
2
2
2
2
2
2
2
2
2
2
2
2
2
2
2
2
2
2
2
2
2
2
2
2
2
2
2
2
2
2
2
2
2
2
2
2
2
2
2
2
2
2
2
2
2
2
2
2
2
2
2
2
2
2
2
2
2
2
2
2
2
2
2
2
2
2
2
2
2
2
2
2
2
2
2
2
2
2
2
2
2
2
2
2
2
2
2
2
2
2
2
2
2
2
2
2
2
2
2
2
2
2
2
2
2
2
2
2
2
2
2
1
1
1
1
1
1
1
1
1
1
1
1
1
1
1
1
1
1
1
1
1
1
1
1
1
1
1
1
1
1
1
1
1
1
1
1
1
1
1
1
1
1
1
1
1
1
1
1
1
1
1
1
1
1
1
1
1
1
1
1
1
1
1
1
1
1
1
1
1
1
1
1
1
1
1
1
1
1
1
1
1
1
1
1
1
1
1
1
1
1
1
1
1
1
1
1
1
1
1
1
1
1
1
1
1
1
1
1
1
1
1
1
1
1
1
1
1
1
1
1
1
1
1
1
1
1
1
1
1
1
1
1
1
1
1
1
1
1
1
1
1
1
1
1
1
1
1
1
1
1
1
1
1
1
1
1
1
1
1
1
1
1
1
1
1
1
1
1
1
1
1
1
1
1
1
1
1
1
1
1
1
1
1
1
1
1
1
1
1
1
1
1
1
1
1
1
1
1
1
1
1
1
1
1
1
1
1
1
1
1
1
1
1
1
1
1
1
1
1
1
1
1
1
1
1
1
1
1
1
1
1
1
1
1
1
1
1
1
1
1
1
1
1
1
1
1
1
1
1
1
1
1
1
1
1
1
1
1
1
1
1
1
1
1
1
1
1
1
1
1
1
1
1
1
1
1
1
1
1
1
1
1
1
1
1
1
1
1
1
1
1
1
1
1
1
1
1
1
1
1
1
1
1
1
1
1
1
1
1
1
1
1
1
1
1
1
1
1
1
1
1
1
1
1
1
1
1
1
1
1
1
1
1
1
1
1
1
1
1
1
1
1
1
1
1
1
1
1
1
1
1
1
1
1
1
1
1
1
1
1
1
1
1
1
1
1
1
1
1
1
1
1
1
1
1
1
1
1
1
1
1
1
1
1
1
1
1
1
1
1
1
1
1
1
1
1
1
1
1
1
1
1
1
1
1
1
1
1
1
1
1
1
1
1
1
1
1
1
1
1
1
1
1
1
1
1
1
1
1
1
1
1
1
1
1
1
1
1
1
1
1
1
1
1
1
1
1
1
1
1
1
1
1
1
1
1
1
1
1
1
1
1
1
1
1
1
1
1
1
1
1
1
1
1
1
1
1
1
1
1
1
1
1
1
1
1
1
1
1
1
1
1
1
1
1
1
1
1
1
1
1
1
1
1
1
1
1
1
1
1
1
1
1
1
1
1
1
1
1
1
1
1
1
1
1
1
1
1
1
1
1
1
1
1
1
1
1
1
1
1
1
1
1
1
1
1
1
1
1
1
1
1
1
1
1
1
1
1
1
1
1
1
1
1
1
1
1
1
1
1
1
1
1
1
1
1
1
1
1
1
1
1
1
1
1
1
1
1
1
1
1
1
1
1
1
1
1
1
1
1
1
1
1
1
1
1
1
1
1
1
1
1
1
1
1
1
1
1
1
1
1
1
1
1
1
1
1
1
1
1
1
1
1
1
1
1
1
1
1
1
1
1
1
1
1
1
1
1
1
1
1
1
1
1
1
1
1
1
1
1
1
1
1
1
1
1
1
1
1
1
1
1
1
1
1
1
1
1
1
1
1
1
1
1
1
1
1
1
1
1
1
1
1
1
1
1
1
1
1
1
1
1
1
1
1
1
1
1
1
1
1
1
1
1
1
1
1
1
1
1
1
1
1
1
1
1
1
1
1
1
1
1
1
1
1
1
1
1
1
1
1
1
1
1
1
1
1
1
1
1
1
1
1
1
1
1
1
1
1
1
1
1
1
1
1
1
1
1
1
1
1
1
1
1
1
1
1
1
1
1
1
1
1
1
1
1
1
1
1
1
1
1
1
1
1
1
1
1
1
1
1
1
1
1
1
1
1
1
1
1
1
1
1
1
1
1
1
1
1
1
1
1
1
1
1
1
1
1
1
1
1
1
1
1
1
1
1
1
1
1
1
1
1
1
1
1
1
1
1
1
1
1
1
1
1
1
1
1
1
1
1
1
1
1
1
1
1
1
1
1
1
1
1
1
1
1
1
1
1
1
1
1
1
1
1
1
1
1
1
1
1
1
1
1
1
1
1
1
1
1
1
1
1
1
1
1
1
1
1
1
1
1
1
1
1
1
1
1
1
1
1
1
1
1
1
1
1
1
1
1
1
1
1
1
1
1
1
1
1
1
1
1
1
1
1
1
1
1
1
1
1
1
1
1
1
1
1
1
1
1
1
1
1
1
1
1
1
1
1
1
1
1
1
1
1
1
1
1
1
1
1
1
1
1
1
1
1
1
1
1
1
1
1
1
1
1
1
1
1
1
1
1
1
1
1
1
1
1
1
1
1
1
1
1
1
1
1
1
1
1
1
1
1
1
1
1
1
1
1
1
1
1
1
1
1
1
1
1
1
1
1
1
1
1
1
1
1
1
1
1
1
1
1
1
1
1
1
1
1
1
1
1
1
1
1
1
1
1
1
1
1
1
1
1
1
1
1
1
1
1
1
1
1
1
1
1
1
1
1
1
1
1
1
1
1
1
1
1
1
1
1
1
1
1
1
1
1
1
1
1
1
1
1
1
1
1
1
1
1
1
1
1
1
1
1
1
1
1
1
1
1
1
1
1
1
1
1
1
1
1
1
1
1
1
1
1
1
1
1
1
1
1
1
1
1
1
1
1
1
1
1
1
1
1
1
1
1
1
1
1
1
1
1
1
1
1
1
1
1
1
1
1
1
1
1
1
1
1
1
1
1
1
1
1
1
1
1
1
1
1
1
1
1
1
1
1
1
1
1
1
1
1
1
1
1
1
1
1
1
1
1
1
1
1
1
1
1
1
1
1
1
1
1
1
1
1
1
1
1
1
1
1
1
1
1
1
1
1
1
1
1
1
1
1
1
1
1
1
1
1
1
1
1
1
1
1
1
1
1
1
1
1
1
1
1
1
1
1
1
1
1
1
1
1
1
1
1
1
1
1
1
1
1
1
1
1
1
1
1
1
1
1
1
1
1
1
1
1
1
1
1
1
1
1
1
1
1
1
1
1
1
1
1
1
1
1
1
1
1
1
1
1
1
1
1
1
1
1
1
1
1
1
1
1
1
1
1
1
1
1
1
1
1
1
1
1
1
1
1
1
1
1
1
1
1
1
1
1
1
1
1
1
1
1
1
1
1
1
1
1
1
1
1
1
1
1
1
1
1
1
1
1
1
1
1
1
1
1
1
1
1
1
1
1
1
1
1
1
1
1
1
1
1
1
1
1
1
1
1
1
1
1
1
1
1
1
1
1
1
1
1
1
1
1
1
1
1
1
1
1
1
1
1
1
1
1
1
1
1
1
1
1
1
1
1
1
1
1
1
1
1
1
1
1
1
1
1
1
1
1
1
1
1
1
1
1
1
1
1
1
1
1
1
1
1
1
1
1
1
1
1
1
1
1
1
1
1
1
1
1
1
1
1
1
1
1
1
1
1
1
1
1
1
1
1
1
1
1
1
1
1
1
1
1
1
1
1
1
1
1
1
1
1
1
1
1
1
1
1
1
1
1
1
1
1
1
1
1
1
1
1
1
1
1
1
1
1
1
1
1
1
1
1
1
1
1
1
1
1
1
1
1
1
1
1
1
1
1
1
1
1
1
1
1
1
1
1
1
1
1
1
1
1
1
1
1
1
1
1
1
1
1
1
1
1
1
1
1
1
1
1
1
1
1
1
1
1
1
1
1
1
1
1
1
1
1
1
1
1
1
1
1
1
1
1
1
1
1
1
1
1
1
1
1
1
1
1
1
1
1
1
1
1
1
1
1
1
1
1
1
1
1
1
1
1
1
1
1
1
1
1
1
1
1
1
1
1
1
1
1
1
1
1
1
1
1
1
1
1
1
1
1
1
1
1
1
1
1
1
1
1
1
1
1
1
1
1
1
1
1
1
1
1
1
1
1
1
1
1
1
1
1
1
1
1
1
1
1
1
1
1
1
1
1
1
1
1
1
1
1
1
1
1
1
1
1
1
1
1
1
1
1
1
1
1
1
1
1
1
1
1
1
1
1
1
1
1
1
1
1
1
1
1
1
1
1
1
1
1
1
1
1
1
1
1
1
1
1
1
1
1
1
1
1
1
1
1
1
1
1
1
1
1
1
1
1
1
1
1
1
1
1
1
1
1
1
1
1
1
1
1
1
1
1
1
1
1
1
1
1
1
1
1
1
1
1
1
1
1
1
1
1
1
1
1
1
1
1
1
1
1
1
1
1
1
1
1
1
1
1
1
1
1
1
1
1
1
1
1
1
1
1
1
1
1
1
1
1
1
1
1
1
1
1
1
1
1
1
1
1
1
1
1
1
1
1
1
1
1
1
1
1
1
1
1
1
1
1
1
1
1
1
1
1
1
1
1
1
1
1
1
1
1
1
1
1
1
1
1
1
1
1
1
1
1
1
1
1
1
1
1
1
1
1
1
1
1
1
1
1
1
1
1
1
1
1
1
1
1
1
1
1
1
1
1
1
1
1
1
1
1
1
1
1
1
1
1
1
1
1
1
1
1
1
1
1
1
1
1
1
1
1
1
1
1
1
1
1
1
1
1
1
1
1
1
1
1
1
1
1
1
1
1
1
1
1
1
1
1
1
1
1
1
1
1
1
1
1
1
1
1
1
1
1
1
1
1
1
1
1
1
1
1
1
1
1
1
1
1
1
1
1
1
1
1
1
1
1
1
1
1
1
1
1
1
1
1
1
1
1
1
1
1
1
1
1
1
1
1
1
1
1
1
1
1
1
1
1
1
1
1
1
1
1
1
1
1
1
1
1
1
1
1
1
1
1
1
1
1
1
Publication Years
1
690
1853
268
11
Category
964
232
219
178
107
50
10
4
Toolboxes
430
362
149
110
103
98
90
85
81
67
62
48
37
33
26
20
19
14
12
10
4
3
3
1
Birth defect has been an emerging major cause of child mortality in the region. Scarcity of the birth defects information hampers policy decisions and control measures at national level. In order to create evidence for action for birth defects prevention in the region, WHO-SEARO in collaboration wit
...
h CDC, USA has developed and launched a regional electronic database on birth defects. This surveillance database allows data collection on newborn health, birth defects and stillbirths cases and provides real time information at hospitals and national level.
Training of the hospital health staffs and data managers in the birth defects surveillance network; at regional, national and at hospital levels is recognized as essential for expansion of this database and to assure quality of data. A two days training module for hospital based birth defects surveillance was developed using a guide for operation and facilitator guide. more
Training of the hospital health staffs and data managers in the birth defects surveillance network; at regional, national and at hospital levels is recognized as essential for expansion of this database and to assure quality of data. A two days training module for hospital based birth defects surveillance was developed using a guide for operation and facilitator guide. more
The WHO South-East Asia (SEA) Region bears a high burden of tuberculosis (TB) and MDR-TB. In 2015, the Region accounted for nearly 200 000 or 35% of the global estimated new RR/MDR-TB cases eligible for treatment. Extensively drug-resistant TB (XDRTB) has also been reported from s
...
ix countries of the SEA Region. MDR-TB could potentially replace drug-susceptible TB, and constitutes a threat to global public health security. The South- East Asia Regional Response Framework for DR-TB 2017–2021 complements the Ending TB in the South-East Asia Region: Regional Strategic Plan 2016–2020” and outlines key strategies for reducing morbidity, mortality and transmission of DR-TB.
more
Vaccins antirabiques: Note de synthèse de l’OMS – avril 2018
Weekly epidemiological record / Relevé épidémiologique hebdomadaire
20 APRIL 2018, 93th YEAR / 20 AVRIL 2018, 93e ANNÉE
Weekly epidemiological record / Relevé épidémiologique hebdomadaire
20 APRIL 2018, 93th YEAR / 20 AVRIL 2018, 93e ANNÉE
This guidance document sets out a methodology to identify and track financing to the WASH sector in a coherent and consistent manner across several countries. It is designed to help countries track financing to the WASH sector on a regular and comparable basis and analyse this information to support
...
evidence-based policy-making based on useful indicators.
more
Reporting Period 2010-2011
This year marked the beginning of the WHO biennium 2016-2017 action plan; this annual report highlights WHO’s key achievements in 2016
It also documents the extraordinary efforts by a broad coalition of government ministries, municipalities, international agencies, community groups, women’s or
...
ganizations, religious and traditional leaders, media, private sector and donors towards restoration and improving health indicators.
more
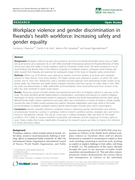
This article reexamines a set of study findings that directly relate to the influence of gender on workplace violence, synthesizes these findings with other research from Rwanda, and examines the subsequent impact of the study on Rwanda’s policy environment.
The objective of the evaluation is to understand whether the CHW program has achieved its intended objectives, thus contributing to the overarching objectives defined in the HSSP III of improving the health status of the population by “Ensuring universal accessibility of quality health services fo
...
r all Rwandans”.
This evaluation has focused on CHWs, who are selected, trained and deployed by the MoH to deliver a defined set of tasks at community level. CHWs are the central element of the Community Health Policy and of the community health strategy plan (CHSP) of the MoH.
more

The report explores strategies for sustaining the country’s responses to the three diseases and eventually transitioning away from external funding and programmatic support. It takes stock of Kenya’s health financing landscape and identifies opportunities and challenges for sustaining effective
...
coverage of HIV, TB, and malaria services in the long run, mindful of macro-fiscal and institutional constraints. The report informs ongoing dialogue within government, including among the Ministry of Health, National Treasury, Council of Governors, and National AIDS Control Council, as well as between government and development partners.
more
Maternal Child Nutrition. 2017;e12478
This paper analyzes individual level and household level determinants of anemia among children and women in Nepal and Pakistan. Applying multivariate modified Poisson models to recent national survey data, we find that the prevalence of anemia was significa ... ntly higher among women from the poorest households in Pakistan (adjusted prevalence ratio [95% CI]: 1.10 [1.04–1.17]), women lacking sanitation facilities in Nepal (1.22 [1.12–1.33]), and among undernourished women (BMI < 18.5 kg/m2) in both countries (Nepal: 1.10 [1.00–1.21] and Pakistan: 1.07 [1.02–1.13]). Similarly, children in both countries were more likely to be anemic if stunted (Nepal: 1.19 [1.09–1.30] and Pakistan: 1.10 [1.07–1.14]) and having an anemic mother (Nepal: 1.31 [1.20–1.42] and Pakistan: 1.21 [1.17–1.26]).
https://doi.org/10.1111/mcn.12478 more
Census Report Volume 4-C
The 2014 Myanmar Census provided the opportunity to measure maternal mortality. The questions on deaths in households during the twelve months prior to the Census were included in the questionnaire, as well as questions necessary to estimate maternal mortality indicator ... s. more
The 2014 Myanmar Census provided the opportunity to measure maternal mortality. The questions on deaths in households during the twelve months prior to the Census were included in the questionnaire, as well as questions necessary to estimate maternal mortality indicator ... s. more
Census Report Volume 4-B
In the 2014 Census, early-age mortality was measured from the responses to two simple retrospective questions on childbearing addressed to ever-married women aged 15 and over. These questions referred to how many live children they had ever given birth to, and how many ... had died (or survived). Adult mortality was measured by using a question on the number of household members who had died during the 12 months preceding the Census.
According to the 2014 Census, infant and child mortality, which comprises under-five mortality, was high compared to other countries in the region. Previous estimates indicated a rapid decline during the 1960s and 1970s, with a substantial deceleration starting in the early 1980s. The decline has accelerated again during recent years. more
Census Report Volume 4-A
This thematic report presents findings on fertility and nuptiality in Myanmar. The analysis hows that the total fertility rate is 2.5 children per woman at the Union level, 1.9 children per woman for urban areas, and 2.8 children per woman for rural areas. Total fertili ... ty for States and Regions varies from a high of 5.0 children per woman for Chin State to a low of 1.8 children per woman for Yangon Region. Total fertility appears to have declined at a rate of at least one child per woman per decade between 1970 and 2000. This relatively rapid decline apparently ceased sometime during the 1990s or 2000s. Estimates from the 2001 and 2007 surveys suggest that the level of fertility may have fluctuated between 2000 and 2014, but with no overall trend up or down. The marital status data shows an exceptionally high proportion of women remaining never married at age 50. more
This thematic report presents findings on fertility and nuptiality in Myanmar. The analysis hows that the total fertility rate is 2.5 children per woman at the Union level, 1.9 children per woman for urban areas, and 2.8 children per woman for rural areas. Total fertili ... ty for States and Regions varies from a high of 5.0 children per woman for Chin State to a low of 1.8 children per woman for Yangon Region. Total fertility appears to have declined at a rate of at least one child per woman per decade between 1970 and 2000. This relatively rapid decline apparently ceased sometime during the 1990s or 2000s. Estimates from the 2001 and 2007 surveys suggest that the level of fertility may have fluctuated between 2000 and 2014, but with no overall trend up or down. The marital status data shows an exceptionally high proportion of women remaining never married at age 50. more
Census Report Volume 4-L
Myanmar’s 2014 Census enumerated 4.5 million people aged 60 and over and by 2050 Myanmar is projected to have 13 million people in this age group.
Myanmar’s population has aged between 1973 and 2014; while the total population increased at an annual rate of 1. ... 4 per cent, the population aged 60 and over increased annually by 2.4 per cent. Within the older population, the oldest age group, those over 80 years old, has been growing much faster than those aged 60-79. In 2014, the urban population was slightly older than the rural population. This is the result of a more rapid decline in urban fertility, offset by net migration to urban areas by youth and young adults. more
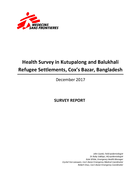
Survey report
Four health surveys were performed in Kutupalong Makeshift Settlment (KMS), Balukhali Makeshift Settlement (BMS), Kutupalong Makeshift Settlement Extension (KMS Extension) and Balukhali Makeshift Settlement Extension (BMS Extension). These sites were chosen to ensure that the health ... status and conditions were measured in both the new settlements and the pre-existing settlements. The surveys measured current and retrospective mortality, the main morbidities affecting the population, global and severe acute malnutrition rates, vaccination coverage rates for key antigens and health-seeking behaviour. Simple random sampling was used with a recall period from 25th February 2017 until the date of interview (30th October to 12th November): approximately 260 days. more
Four health surveys were performed in Kutupalong Makeshift Settlment (KMS), Balukhali Makeshift Settlement (BMS), Kutupalong Makeshift Settlement Extension (KMS Extension) and Balukhali Makeshift Settlement Extension (BMS Extension). These sites were chosen to ensure that the health ... status and conditions were measured in both the new settlements and the pre-existing settlements. The surveys measured current and retrospective mortality, the main morbidities affecting the population, global and severe acute malnutrition rates, vaccination coverage rates for key antigens and health-seeking behaviour. Simple random sampling was used with a recall period from 25th February 2017 until the date of interview (30th October to 12th November): approximately 260 days. more
(Health Systems in Transition, Vol. 4, No. 3, 2014)
The Sendai Framework for Disaster Risk Reduction 2015-2030 outlines seven clear targets and four priorities for action to prevent new and reduce existing disaster risks: (i) Understanding disaster risk; (ii) Strengthening disaster risk governance to manage disaster risk; (iii) Investing in disaster
...
reduction for resilience and; (iv) Enhancing disaster preparedness for effective response, and to "Build Back Better" in recovery, rehabilitation and reconstruction.
It aims to achieve the substantial reduction of disaster risk and losses in lives, livelihoods and health and in the economic, physical, social, cultural and environmental assets of persons, businesses, communities and countries over the next 15 years. more
It aims to achieve the substantial reduction of disaster risk and losses in lives, livelihoods and health and in the economic, physical, social, cultural and environmental assets of persons, businesses, communities and countries over the next 15 years. more