Filter
5606
Text search:
aid
Featured
520
1609
Language
5021
361
134
95
79
60
41
29
25
22
21
14
12
11
10
10
10
10
9
9
9
8
8
8
8
8
7
7
7
7
7
6
6
6
5
5
5
5
4
4
4
4
4
3
3
3
3
3
2
2
2
2
2
2
2
2
2
2
1
1
1
1
1
1
1
1
1
1
1
Document type
3294
859
514
312
174
128
122
95
39
34
17
9
6
1
1
Countries
221
197
181
146
138
133
128
119
113
106
105
102
99
94
92
74
73
72
71
69
67
66
60
57
55
55
48
48
46
45
44
42
41
40
39
35
35
31
29
29
29
27
27
25
24
23
23
22
20
20
19
18
17
15
14
14
14
13
13
13
13
13
12
12
11
10
10
10
10
9
9
9
9
8
8
7
7
7
7
7
7
7
6
6
5
5
5
5
5
5
5
5
4
4
4
4
4
4
4
4
3
3
3
3
3
3
3
3
2
2
2
2
2
2
2
2
2
2
2
2
2
2
2
2
2
1
1
1
1
1
1
1
1
1
1
1
1
1
1
1
1
1
1
1
Authors & Publishers
475
227
198
119
111
109
101
89
71
68
65
53
41
33
32
31
30
29
29
29
28
27
26
26
25
23
22
21
21
20
19
18
18
18
17
17
16
16
16
15
15
15
15
14
14
14
14
14
14
14
14
13
13
13
13
13
12
12
12
12
12
12
11
11
11
11
11
11
11
11
10
10
10
10
10
10
10
9
9
9
9
9
9
9
9
9
9
9
9
9
9
9
8
8
8
8
8
8
8
8
8
8
8
8
7
7
7
7
7
7
7
7
7
7
7
7
7
7
7
7
7
7
7
7
7
7
7
7
7
7
6
6
6
6
6
6
6
6
6
6
6
6
6
6
6
6
6
6
6
6
6
6
6
5
5
5
5
5
5
5
5
5
5
5
5
5
5
5
5
5
5
5
5
5
5
5
5
5
5
5
5
5
5
5
5
5
5
5
5
5
5
5
5
5
5
5
5
5
5
5
4
4
4
4
4
4
4
4
4
4
4
4
4
4
4
4
4
4
4
4
4
4
4
4
4
4
4
4
4
4
4
4
4
4
4
4
4
4
4
4
4
4
4
4
4
4
4
4
4
4
4
4
4
4
4
4
4
3
3
3
3
3
3
3
3
3
3
3
3
3
3
3
3
3
3
3
3
3
3
3
3
3
3
3
3
3
3
3
3
3
3
3
3
3
3
3
3
3
3
3
3
3
3
3
3
3
3
3
3
3
3
3
3
3
3
3
3
3
3
3
3
3
3
3
3
3
3
3
3
3
3
3
3
3
3
3
3
3
3
3
3
3
3
3
3
3
3
3
3
3
3
3
3
3
3
3
3
3
3
3
3
3
3
3
3
3
3
3
3
3
3
3
3
3
3
3
3
3
3
3
3
3
3
3
3
3
3
3
3
3
3
3
3
3
3
3
3
3
3
3
3
2
2
2
2
2
2
2
2
2
2
2
2
2
2
2
2
2
2
2
2
2
2
2
2
2
2
2
2
2
2
2
2
2
2
2
2
2
2
2
2
2
2
2
2
2
2
2
2
2
2
2
2
2
2
2
2
2
2
2
2
2
2
2
2
2
2
2
2
2
2
2
2
2
2
2
2
2
2
2
2
2
2
2
2
2
2
2
2
2
2
2
2
2
2
2
2
2
2
2
2
2
2
2
2
2
2
2
2
2
2
2
2
2
2
2
2
2
2
2
2
2
2
2
2
2
2
2
2
2
2
2
2
2
2
2
2
2
2
2
2
2
2
2
2
2
2
2
2
2
2
2
2
2
2
2
2
2
2
2
2
2
2
2
2
2
2
2
2
2
2
2
2
2
2
2
2
2
2
2
2
2
2
2
2
2
2
2
2
2
2
2
2
2
2
2
2
2
2
2
2
2
2
2
2
2
2
2
2
2
2
2
2
2
2
2
2
2
2
2
2
2
2
2
2
2
2
2
2
2
2
2
2
2
2
2
2
2
2
2
2
2
2
2
2
2
2
2
2
2
2
2
2
2
2
2
2
2
2
2
2
2
2
2
2
2
2
2
2
2
2
2
2
2
2
2
2
2
2
2
2
2
2
2
2
2
2
2
2
2
2
2
2
2
2
2
2
2
2
2
2
2
2
2
2
2
2
2
2
2
2
2
2
2
2
2
2
2
2
2
2
2
2
2
2
2
2
2
2
2
2
2
2
2
2
2
2
2
2
2
2
2
2
2
1
1
1
1
1
1
1
1
1
1
1
1
1
1
1
1
1
1
1
1
1
1
1
1
1
1
1
1
1
1
1
1
1
1
1
1
1
1
1
1
1
1
1
1
1
1
1
1
1
1
1
1
1
1
1
1
1
1
1
1
1
1
1
1
1
1
1
1
1
1
1
1
1
1
1
1
1
1
1
1
1
1
1
1
1
1
1
1
1
1
1
1
1
1
1
1
1
1
1
1
1
1
1
1
1
1
1
1
1
1
1
1
1
1
1
1
1
1
1
1
1
1
1
1
1
1
1
1
1
1
1
1
1
1
1
1
1
1
1
1
1
1
1
1
1
1
1
1
1
1
1
1
1
1
1
1
1
1
1
1
1
1
1
1
1
1
1
1
1
1
1
1
1
1
1
1
1
1
1
1
1
1
1
1
1
1
1
1
1
1
1
1
1
1
1
1
1
1
1
1
1
1
1
1
1
1
1
1
1
1
1
1
1
1
1
1
1
1
1
1
1
1
1
1
1
1
1
1
1
1
1
1
1
1
1
1
1
1
1
1
1
1
1
1
1
1
1
1
1
1
1
1
1
1
1
1
1
1
1
1
1
1
1
1
1
1
1
1
1
1
1
1
1
1
1
1
1
1
1
1
1
1
1
1
1
1
1
1
1
1
1
1
1
1
1
1
1
1
1
1
1
1
1
1
1
1
1
1
1
1
1
1
1
1
1
1
1
1
1
1
1
1
1
1
1
1
1
1
1
1
1
1
1
1
1
1
1
1
1
1
1
1
1
1
1
1
1
1
1
1
1
1
1
1
1
1
1
1
1
1
1
1
1
1
1
1
1
1
1
1
1
1
1
1
1
1
1
1
1
1
1
1
1
1
1
1
1
1
1
1
1
1
1
1
1
1
1
1
1
1
1
1
1
1
1
1
1
1
1
1
1
1
1
1
1
1
1
1
1
1
1
1
1
1
1
1
1
1
1
1
1
1
1
1
1
1
1
1
1
1
1
1
1
1
1
1
1
1
1
1
1
1
1
1
1
1
1
1
1
1
1
1
1
1
1
1
1
1
1
1
1
1
1
1
1
1
1
1
1
1
1
1
1
1
1
1
1
1
1
1
1
1
1
1
1
1
1
1
1
1
1
1
1
1
1
1
1
1
1
1
1
1
1
1
1
1
1
1
1
1
1
1
1
1
1
1
1
1
1
1
1
1
1
1
1
1
1
1
1
1
1
1
1
1
1
1
1
1
1
1
1
1
1
1
1
1
1
1
1
1
1
1
1
1
1
1
1
1
1
1
1
1
1
1
1
1
1
1
1
1
1
1
1
1
1
1
1
1
1
1
1
1
1
1
1
1
1
1
1
1
1
1
1
1
1
1
1
1
1
1
1
1
1
1
1
1
1
1
1
1
1
1
1
1
1
1
1
1
1
1
1
1
1
1
1
1
1
1
1
1
1
1
1
1
1
1
1
1
1
1
1
1
1
1
1
1
1
1
1
1
1
1
1
1
1
1
1
1
1
1
1
1
1
1
1
1
1
1
1
1
1
1
1
1
1
1
1
1
1
1
1
1
1
1
1
1
1
1
1
1
1
1
1
1
1
1
1
1
1
1
1
1
1
1
1
1
1
1
1
1
1
1
1
1
1
1
1
1
1
1
1
1
1
1
1
1
1
1
1
1
1
1
1
1
1
1
1
1
1
1
1
1
1
1
1
1
1
1
1
1
1
1
1
1
1
1
1
1
1
1
1
1
1
1
1
1
1
1
1
1
1
1
1
1
1
1
1
1
1
1
1
1
1
1
1
1
1
1
1
1
1
1
1
1
1
1
1
1
1
1
1
1
1
1
1
1
1
1
1
1
1
1
1
1
1
1
1
1
1
1
1
1
1
1
1
1
1
1
1
1
1
1
1
1
1
1
1
1
1
1
1
1
1
1
1
1
1
1
1
1
1
1
1
1
1
1
1
1
1
1
1
1
1
1
1
1
1
1
1
1
1
1
1
1
1
1
1
1
1
1
1
1
1
1
1
1
1
1
1
1
1
1
1
1
1
1
1
1
1
1
1
1
1
1
1
1
1
1
1
1
1
1
1
1
1
1
1
1
1
1
1
1
1
1
1
1
1
1
1
1
1
1
1
1
1
1
1
1
1
1
1
1
1
1
1
1
1
1
1
1
1
1
1
1
1
1
1
1
1
1
1
1
1
1
1
1
1
1
1
1
1
1
1
1
1
1
1
1
1
1
1
1
1
1
1
1
1
1
1
1
1
1
1
1
1
1
1
1
1
1
1
1
1
1
1
1
1
1
1
1
1
1
1
1
1
1
1
1
1
1
1
1
1
1
1
1
1
1
1
1
1
1
1
1
1
1
1
1
1
1
1
1
1
1
1
1
1
1
1
1
1
1
1
1
1
1
1
1
1
1
1
1
1
1
1
1
1
1
1
1
1
1
1
1
1
1
1
1
1
1
1
1
1
1
1
1
1
1
1
1
1
1
1
1
1
1
1
1
1
1
1
1
1
1
1
1
1
1
1
1
1
1
1
1
1
1
1
1
1
1
1
1
1
1
1
1
1
1
1
1
1
1
1
1
1
1
1
1
1
1
1
1
1
1
1
1
1
1
1
1
1
1
1
1
1
1
1
1
1
1
1
1
1
1
1
1
1
1
1
1
1
1
1
1
1
1
1
1
1
1
1
1
1
1
1
1
1
1
1
1
1
1
1
1
1
1
1
1
1
1
1
1
1
1
1
1
1
1
1
1
1
1
1
1
1
1
1
1
1
1
1
1
1
1
1
1
1
1
1
1
1
1
1
1
1
1
1
1
1
1
1
1
1
1
1
1
1
1
1
1
1
1
1
1
1
1
1
1
1
1
1
1
1
1
1
1
1
1
1
1
1
1
1
1
1
1
1
1
1
1
1
1
1
1
1
1
1
1
1
1
1
1
1
1
1
1
1
1
1
1
1
1
1
1
1
1
1
1
1
1
1
1
1
1
1
1
1
1
1
1
1
1
1
1
1
1
1
1
1
1
1
1
1
1
1
1
1
1
1
1
1
1
1
1
1
1
1
1
1
1
1
1
1
1
1
1
1
1
1
1
1
1
1
1
1
1
1
1
1
1
1
1
1
1
1
1
1
1
1
1
1
1
1
1
1
1
1
1
1
1
1
1
1
1
1
1
1
1
1
1
1
1
1
1
1
1
1
1
1
1
1
1
1
1
1
1
1
1
1
1
1
1
1
1
1
1
1
1
1
1
1
1
1
1
1
1
1
1
1
1
1
1
1
1
1
1
1
1
1
1
1
1
1
1
1
1
1
1
1
1
1
1
1
1
1
1
1
1
1
1
1
1
1
1
1
1
1
1
1
1
1
1
1
1
1
1
1
1
1
1
1
1
1
1
1
1
1
1
1
1
1
1
1
1
1
1
1
1
1
1
1
1
1
1
1
1
1
1
1
1
1
1
1
1
1
1
1
1
1
1
1
1
1
1
1
1
1
1
1
1
1
1
1
1
1
1
1
1
1
1
1
1
1
1
1
1
1
1
1
1
1
1
1
1
1
1
1
1
1
1
1
1
1
1
1
1
1
1
1
1
1
1
1
1
1
1
1
1
1
1
1
1
1
1
1
1
1
1
1
1
1
1
1
1
1
1
1
1
1
1
1
1
1
1
1
1
1
1
1
1
1
1
1
1
1
1
1
1
1
1
1
1
1
1
1
1
1
1
1
1
1
1
1
1
1
1
1
1
1
1
1
1
1
1
1
1
1
1
1
1
1
1
1
1
1
1
1
1
1
1
1
1
1
1
1
1
1
1
1
1
1
1
1
1
1
1
1
1
1
1
1
1
1
1
1
1
1
1
1
1
1
1
1
1
1
1
1
1
1
1
1
1
1
1
1
1
1
1
1
1
1
1
1
1
1
1
1
1
1
1
1
1
1
1
1
1
1
1
1
1
1
1
1
1
1
1
1
1
1
1
1
1
1
1
1
1
1
1
1
1
1
1
1
1
1
1
1
1
1
1
1
1
1
1
1
1
1
1
1
1
1
1
1
1
1
1
1
1
1
1
1
1
1
1
1
1
1
1
1
1
1
1
1
1
1
1
1
1
1
1
1
1
1
1
1
1
1
1
1
1
1
1
1
1
1
1
1
1
1
1
1
1
1
1
1
1
1
1
1
1
1
1
1
1
1
1
1
1
1
1
1
1
1
1
1
1
1
1
1
1
1
1
1
1
1
1
1
1
1
1
1
1
1
1
1
1
1
1
1
1
1
1
1
1
1
1
1
1
1
1
1
1
1
1
1
1
1
1
1
1
1
1
1
1
1
1
1
1
1
1
1
1
1
1
1
1
1
1
1
1
1
1
1
1
1
1
1
1
1
1
1
1
1
1
1
1
1
1
1
1
1
1
1
1
1
1
1
1
1
1
1
1
1
1
1
1
1
1
1
1
1
1
1
1
1
1
1
1
1
1
1
1
1
1
1
1
1
1
1
1
1
1
1
1
1
1
1
1
1
1
1
1
1
1
1
1
1
1
1
1
1
1
1
1
1
1
1
1
1
1
1
1
1
1
1
1
1
1
1
1
1
1
1
1
1
1
1
1
1
1
1
1
1
1
1
1
1
1
1
1
1
1
1
1
1
1
1
1
1
1
1
1
1
1
1
1
1
1
1
1
1
1
1
1
1
1
1
1
1
1
1
1
1
1
1
1
1
1
1
1
1
1
1
1
1
1
1
1
1
1
1
1
1
1
1
1
1
1
1
1
1
1
1
1
1
1
1
1
1
1
1
1
1
1
1
1
1
1
1
1
1
1
1
1
1
1
1
1
1
1
1
1
1
1
1
1
1
1
1
1
1
1
1
1
1
1
1
1
1
1
1
1
1
1
1
1
1
1
1
1
1
1
1
1
1
1
1
1
1
1
1
1
1
1
1
1
1
1
1
1
1
1
1
1
1
1
1
1
1
1
1
1
1
1
1
1
1
1
1
1
1
1
1
1
1
1
1
1
1
1
1
1
1
1
1
1
1
1
1
1
1
1
1
1
1
1
1
1
1
1
1
1
1
1
1
1
1
1
1
1
1
1
1
1
1
1
1
1
1
1
1
1
1
1
1
1
1
1
1
1
1
1
1
1
1
1
1
1
1
1
1
1
1
1
1
1
1
1
1
1
1
1
1
1
1
1
1
1
1
1
1
1
1
1
1
1
1
1
1
1
1
1
1
1
1
1
1
1
1
1
1
1
1
1
1
1
1
1
1
1
1
1
1
1
1
1
1
1
1
1
1
1
1
1
1
1
1
1
1
1
1
1
1
1
1
1
1
1
1
1
1
1
1
1
1
1
1
1
1
1
1
1
1
1
1
1
1
1
1
1
1
1
1
1
1
1
1
1
1
1
1
1
1
1
1
1
1
1
1
1
1
1
1
1
1
1
1
1
1
1
1
1
1
1
1
1
1
1
1
1
1
1
1
1
1
1
1
1
1
1
1
1
1
1
1
1
1
1
1
1
1
1
1
1
1
1
1
1
1
1
1
1
1
1
1
1
1
1
1
1
1
1
1
1
1
1
1
1
1
1
1
1
1
1
1
1
1
1
1
1
1
1
1
1
1
1
1
1
1
1
1
1
1
1
1
1
1
1
1
1
1
1
1
1
1
1
1
1
1
1
1
1
1
1
1
1
1
1
1
1
1
1
1
1
1
1
1
1
1
1
1
1
1
1
1
1
1
1
1
1
1
1
1
1
1
1
1
1
1
1
1
1
1
1
1
1
1
1
1
1
1
1
1
1
1
1
1
1
1
1
1
1
1
1
1
1
1
1
1
1
1
1
1
1
1
1
1
1
1
1
1
1
1
1
1
1
1
1
1
1
1
1
1
1
1
1
1
1
1
1
1
1
1
1
1
1
1
1
1
1
1
1
1
1
1
1
1
1
1
1
1
1
1
1
1
1
1
1
1
1
1
1
1
1
1
1
1
1
1
1
1
1
1
1
1
1
1
1
1
1
1
1
1
1
1
1
1
1
1
1
1
1
1
1
1
1
1
1
1
1
1
1
1
1
1
1
1
1
1
1
1
1
1
1
1
1
1
1
1
1
1
1
1
1
1
1
1
1
1
1
1
1
1
1
1
1
1
1
1
1
1
1
1
1
1
1
1
1
1
1
1
1
1
1
1
1
1
1
1
1
1
1
1
1
1
1
1
1
1
1
1
1
1
1
1
1
1
1
1
1
1
1
1
1
1
1
1
1
1
1
1
1
1
1
1
1
1
1
1
1
1
1
1
1
1
1
1
1
1
1
1
1
1
1
1
1
1
1
1
1
1
1
1
1
1
1
1
1
1
1
1
1
1
1
1
1
1
1
1
1
1
1
1
1
1
1
1
1
1
1
1
1
1
1
1
1
1
1
1
1
1
1
1
1
1
1
1
1
1
1
1
1
1
1
1
1
1
1
1
1
1
1
1
1
1
1
1
1
1
1
1
1
1
1
1
1
1
1
1
1
1
1
1
1
1
1
1
1
1
1
1
1
1
1
1
1
1
1
1
1
1
1
1
1
1
1
1
1
1
1
1
1
1
1
1
1
1
1
1
1
1
1
1
1
1
1
1
1
1
1
1
1
1
1
1
1
1
1
1
1
1
1
1
1
1
1
1
1
1
1
1
1
1
1
1
1
1
1
1
1
1
1
1
1
1
1
1
1
1
1
1
1
1
1
1
1
1
1
1
1
1
1
1
1
1
1
1
1
1
1
1
1
1
1
1
1
1
1
1
1
1
1
1
1
1
1
1
1
1
1
1
1
1
1
1
1
1
1
1
1
1
1
1
1
1
1
1
1
1
1
1
1
1
1
1
1
1
1
1
1
1
1
1
1
1
1
1
1
1
1
1
1
1
1
1
1
1
1
1
1
1
1
1
1
1
1
1
1
1
1
1
1
1
1
1
1
1
1
1
1
1
1
1
1
1
1
1
1
1
1
1
1
1
1
1
1
1
1
1
1
1
1
1
1
1
1
1
1
1
1
1
1
1
1
1
1
1
1
1
1
1
1
1
1
1
1
1
1
1
1
1
1
1
1
1
1
1
1
1
1
1
1
1
1
1
1
1
1
1
1
1
1
1
1
1
1
1
1
1
1
1
1
1
1
1
1
1
1
1
1
1
1
1
1
1
1
1
1
1
1
1
1
1
1
1
1
1
1
1
1
1
1
1
1
1
1
1
1
1
1
1
1
1
1
1
1
1
1
1
1
1
1
1
1
1
1
1
1
1
1
1
1
1
1
1
1
1
1
1
1
1
1
1
1
1
1
1
1
1
1
1
1
1
1
1
1
1
1
1
1
1
1
1
1
1
1
1
1
1
1
1
1
1
1
1
1
1
1
1
1
1
1
1
1
1
1
1
1
1
1
1
1
1
1
1
1
1
1
1
1
1
1
1
1
1
1
1
1
1
1
1
1
1
1
1
1
1
1
1
1
1
1
1
1
1
1
1
1
1
1
1
1
1
1
1
1
1
1
1
1
1
1
1
1
1
1
1
1
1
1
1
1
1
1
1
1
1
1
1
1
1
1
1
1
1
1
1
1
1
1
1
1
1
1
1
1
1
1
1
1
1
1
1
1
1
1
1
1
1
1
1
1
1
1
1
1
1
1
1
1
1
1
1
1
1
1
1
1
1
1
1
1
1
1
1
1
1
1
1
1
1
1
1
1
1
1
1
1
1
1
1
1
1
1
1
1
1
1
1
1
1
1
1
1
1
1
1
1
1
1
1
1
1
1
1
1
1
1
1
1
1
1
1
1
1
1
1
1
1
1
1
1
1
1
1
1
1
1
1
1
1
1
1
1
1
1
1
1
1
1
1
1
1
1
1
1
1
1
1
1
1
1
1
1
1
1
1
1
1
1
1
1
1
1
1
1
1
1
1
1
1
1
1
1
1
1
1
1
1
1
1
1
1
1
1
1
1
1
1
1
1
1
1
1
1
1
1
1
1
1
1
1
1
1
1
1
1
1
1
1
1
1
1
1
1
1
1
1
1
1
1
1
1
1
1
1
1
1
1
1
1
1
1
1
1
1
1
1
1
1
1
1
1
1
1
1
1
1
1
1
1
1
1
1
1
1
1
1
1
1
1
1
1
1
1
1
1
1
1
1
1
1
1
1
1
1
1
1
1
1
1
1
1
1
1
1
1
1
1
1
1
1
1
1
1
1
1
1
1
1
1
1
1
1
1
1
1
1
1
1
1
1
1
1
1
1
1
1
1
1
1
1
1
1
1
1
1
1
1
1
1
1
1
1
1
1
1
1
1
1
1
1
1
1
1
1
1
1
1
1
1
1
1
1
1
1
1
1
1
1
1
1
1
1
1
1
1
1
1
1
1
1
1
1
1
1
1
1
1
1
1
1
1
1
1
1
1
1
1
1
1
1
1
1
1
1
1
1
1
1
1
1
1
1
1
1
1
1
1
1
1
1
1
1
1
1
1
1
1
1
1
1
1
1
1
1
1
1
1
1
1
1
1
1
1
1
1
1
1
1
1
1
1
1
1
1
1
1
1
1
1
1
1
1
1
1
1
1
1
1
1
1
1
1
1
1
1
1
1
1
1
1
1
1
1
1
1
1
1
1
1
1
1
1
1
1
1
1
1
1
1
1
1
1
1
1
1
1
1
1
1
1
1
1
1
1
1
1
1
1
1
1
1
1
1
1
1
1
1
Publication Years
1444
3582
541
36
1
1
1
Category
2104
321
305
267
245
190
56
11
4
3
Toolboxes
446
427
384
303
251
204
184
173
165
153
144
143
139
91
84
80
67
54
44
35
33
24
22
13
2
2
DHS Further Analysis Reports No. 109 - This report documents trends in key child nutrition indicators in Rwanda. Data from the Demographic and Health Surveys (DHS) in 2005, 2010, and 2014-15 were analyzed, disaggregated by selected equity-related variables, and tested for trends. Over the survey per
...
iod, Rwanda had high rates of exclusive breastfeeding, with regional variation. Rates of continued breastfeeding were also high but generally decreased as mother’s education and household wealth increased in all survey years. Complementary feeding practices varied by region, mother’s education, household wealth, urban-rural residence, and sex of the child.
more
DHS Further Analysis Reports No. 108 - This report examines levels, trends, and inequalities in maternal health in Rwanda from 2010 to 2014-15 among women age 15-49 with a recent birth. The analysis uses Demographic and Health Survey (DHS) data for 15 key indicators of maternal health: 6 for antenat
...
al care, 3 for delivery, 1 for postnatal care, and 5 for barriers to accessing medical care. Levels and trends in these indicators were analyzed overall and by three background characteristics: women’s education, household wealth quintile, and region.
more

HIV Knowledge and Risky Sexual Behavior among Men in Rwanda
Rugigana, Etienne, Francine Birungi, and Manassé Nzayirambaho
Rockville, Maryland, USA: ICF International
(2014)
C2
DHS Working Papers No. 105 - Rwanda has developed and implemented many strategies at the national level to reduce the incidence of HIV in the general population. One of the main objectives of such interventions is to improve the general level of knowledge of HIV, with the hypothesis that increasing
...
HIV knowledge will reduce risky sexual behavior. However, there has been a concern that HIV knowledge may not necessarily reduce risky sexual behavior. Only a limited number of population-based studies describe the results of these interventions in terms of how HIV knowledge affects risky sexual behavior. Therefore, the aim of this paper is to fill in this gap, by exploring HIV knowledge and its effect on risky sexual behavior among men in Rwanda.
more
This report investigates the impact of potential misclassification of samples on HIV prevalence estimates for 23 surveys conducted from 2010-2014. In addition to visual inspection of laboratory results, we examined how accounting for potential misclassification of HIV status through Bayesian latent
...
class models affected the prevalence estimates. Two types of Bayesian models were specified: a model that only uses the individual dichotomous test results and a continuous model that uses the quantitative information of the EIA (i.e., the signal-to-cutoff values). Overall, we found that adjusted prevalence estimates matched the surveys’ original results, with overlapping uncertainty intervals. This suggested that misclassification of HIV status should not affect the prevalence estimates in most surveys. However, our analyses suggested that two surveys may be problematic. The prevalence could have been overestimated in the Uganda AIDS Indicator Survey 2011 and the Zambia Demographic and Health Survey 2013-14, although the magnitude of overestimation remains difficult to ascertain. Interpreting results from the Uganda survey is difficult because of the lack of internal quality control and potential violation of the multivariate normality assumption of the continuous Bayesian latent class model. In conclusion, despite the limitations of our latent class models, our analyses suggest that prevalence estimates from most of the surveys reviewed are not affected by sample misclassification.
more
Levels and Inequities
DHS Further Analysis Reports No. 110
This study shows large variations in maternal health indicators across high-priority counties in Kenya. Nairobi exceeds the national average on all maternal health indicators in this study, while other highpriority counties consist ... ently are disadvantaged compared with Kenya as a whole in most maternal health indicators. Kisumu exceeds the national average in use of antenatal care, delivery in a health facility, and postnatal care, but not other indicators. Nakuru has fewer women with fertility risk and fewer women who report that the distance they must travel to reach a health facility is a problem.
This study identifies a number of inequities in maternal health indicators across socio-demographic characteristics in the high-priority counties—most in the distribution of delivery care and least in antenatal care. Inequities are also observed in fertility risk and postnatal care. more
DHS Further Analysis Reports No. 111
This study is a theory-driven analysis of the socio-demographic determinants of maternal care seeking in Kenya. Specifically, it examines predisposing, enabling, and need factors potentially associated with use of antenatal care (ANC), health facility delive ... ry, and timely postnatal care (PNC).
This study uses data from the 2014 Kenya Demographic and Health Survey (KDHS) conducted among women age 15-49 with a live birth in the five years preceding the survey. It includes data from all 47 counties of Kenya, grouped contiguously into 12 regions. We apply Andersen’s Behavioral Model of Health Services Use to examine socio-demographic predictors of health service use. We estimate logistic regression models for adequate use of ANC (defined as attending at least four ANC visits, starting in the first three months of pregnancy), delivery in a health facility, and PNC within 48 hours of delivery. more
DHS Methodological Report No. 20
This study used Service Provision Assessment (SPA) and Demographic and Health Survey (DHS) data from Haiti, Malawi, and Tanzania to compare traditionally used additive methods with a data reduction method—principal component analysis (PCA).
We scored ... the quality of health facilities with three approaches (simple additive, weighted additive, and PCA) for two constructs: quality of services, with only facilities-level data, and quality of care, which incorporates observation and client data. We ranked facilities as high, medium, or low quality based on their scores. Our results indicated that the rankings change with the scoring methodology. There was more consistency in the rankings of facilities by the simple additive and PCA methods than the weighted additive and PCA-based rankings. This may be due to the low factor loadings and little variance explained by the first component in the PCA. We aggregated facility scores to their respective DHS clusters (Haiti, Malawi) or regions (Tanzania) and geographically linked them to women interviewed in DHS surveys to test associations between the use of family planning services and the quality environment, as measured with each index. more
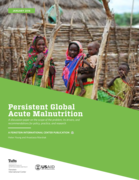
A discussion paper on the scope of the problem, its drivers, and strategies for moving forward for policy, practice, and research
In many protracted emergencies, the prevalence rates of global acute malnutrition (GAM) regularly exceed the emergency threshold of > 15% of children with acute malnutri
...
tion (< -2 weight-for-height z-scores (WHZ) or with nutritional edema), despite ongoing humanitarian interventions. The widespread scale and long-lasting nature of “persistent GAM” means that it is a policy and programming priority.
more
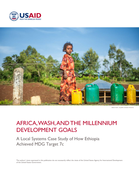
Ethiopia met the MDG target for drinking water access with a unique and high degree of success. The magnitude of the country’s success in providing improved drinking water to nearly half of its population in 25 years despite its diversity, size, and challenges cannot be overstated. This case study
...
documents the progress of the Ethiopian WASH sector from 1990 to 2015, and analyzes the impact of local systems created in Ethiopia to respond to water and sanitation challenges.
more
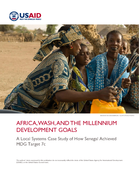
Nationally, Senegal met the MDG target for water supply access. It did this by engaging the public and private sectors to effectively invest and report on investments. It focused on larger population centers, less on remote regions of the country. Its achievements set the stage for more equitable an
...
d widespread service provision as the country now works to achieve the SDGs, requiring sustainable management of universal access. This case study documents the progression of the sector between 1990 and 2015, and analyzes the impact of local systems created in Senegal to respond to the water and sanitation challenge.
more
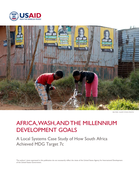
Democratic dispensation in 1994 created a political and social platform that reshaped life in South Africa. There was a surge in common belief that the inequity and wrong of Apartheid should and could be rectified. Equity of access to water and sanitation were obvious targets for improvement. In 199
...
4, an estimated 14–15 million South Africans were without access to an improved water supply, while close to 21 million - more than half of the population at that time - did not have access to improved sanitation facilities. These problems were most severe in poorer rural areas. The water and sanitation sector became unified by the vision of universal access for all South Africans. This case study documents the progression of the sector between 1994 and 2016, and analyzes the impact of local systems created in South Africa to respond to the water and sanitation challenge.
more
USAID/Afghanistan’s $443 million investment in the Afghan Sustainable Water Supply and Sanitation (SWSS) activity is one of the Agency’s largest single investments in sustainable rural water supply delivery. The project installed about 2,123 wells with hand pumps across Afghanistan from 2009–2
...
012. This report presents findings from a retrospective evaluation of a random selection of wells with hand pumps installed under the SWSS project.
This evaluation’s key purpose is to identify factors that support and hinder sustainable water service delivery in different contexts. more
This evaluation’s key purpose is to identify factors that support and hinder sustainable water service delivery in different contexts. more
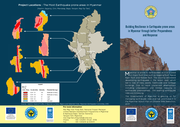
In many of Myanmar’s contested regions, healthcare services are provided through two parallel governance systems – by the government’s Ministry of Health, and by providers linked to ethnic armed organizations. Building upon efforts to build trust between these two actors following ceasefires s
...
igned in 2011 and 2012, the new National League for Democracy-led government offers an unprecedented opportunity to increase cooperation between these systems and to ensure health services reach Myanmar’s most vulnerable populations.
The report provides an overview of existing health service arrangements in these areas, from both the Ministry of Health and from ethnic and community-based health organizations. It then unpacks the concept of “convergence”, highlighting key opportunities and policy recommendations for both government and non-government actors. more
The report provides an overview of existing health service arrangements in these areas, from both the Ministry of Health and from ethnic and community-based health organizations. It then unpacks the concept of “convergence”, highlighting key opportunities and policy recommendations for both government and non-government actors. more

This resource aims to provide relevant and practical guidance to DRR practitioners (policy and programme colleagues), on how to ensure inclusion - particularly of vulnerable groups - in Community-Based DRR (CBDRR) initiatives in Myanmar. It comprises an overall Framework for inclusive CBDRR and a nu
...
mber of tools/resources including: 1) a checklist for inclusion in the 7 steps of the CBDRR process, 2) a guideline for documenting inclusion, 3) a template for assessing inclusion and 4) a compendium of tools and guidelines relevant to inclusive CBDRR.
The Inclusive Framework and Toolkit for Community-Based DRR in Myanmar is a resource produced by the Myanmar Consortium for Community Resilience (MCCR), a consortium led by ActionAid, with ACF, HelpAge, Oxfam, Plan and UN-Habitat. more
The Inclusive Framework and Toolkit for Community-Based DRR in Myanmar is a resource produced by the Myanmar Consortium for Community Resilience (MCCR), a consortium led by ActionAid, with ACF, HelpAge, Oxfam, Plan and UN-Habitat. more
Submitted to the US Agency for International Development by the Systems for Improved Access to Pharmaceuticals and Services (SIAPS) Program. Arlington, VA: Management Sciences for Health. Submitted to the United Nations Children’s Fund by JSI, Arlington, VA: JSI Research & Training Institute, Inc.
...
This guide will assist program managers, service providers, and technical experts when conducting a quantification of commodity needs for the 13 reproductive, maternal, newborn, and child health commodities prioritized by the UN Commission on Life-Saving Commodities for Women and Children. This quantification supplement should be used with the main guide—Quantification of Health Commodities: A Guide to Forecasting and Supply Planning for Procurement. * This supplement describes the steps in forecasting consumption of these supplies when consumption and service data are not available; after which, to complete the quantification, the users should refer to the main quantification guide for the supply planning step.
more
The USAID | DELIVER PROJECT, Task Order 4, developed this guide for quantifying health commodities; it will assist technical advisors, program managers, warehouse managers, procurement officers, and service providers in (1) estimating the total commodity needs and costs for successful implementation
...
of national health program strategies and goals, (2) identifying the funding needs and gaps for procuring the required commodities, and (3) planning procurements and shipment delivery schedules to ensure a sustained and effective supply of health commodities.
The step-by-step approach to quantification presented in this guide is complemented by a set of product-specific companion pieces that include detailed instructions for forecasting consumption of antiretroviral drugs, HIV test kits, antimalarial drugs, and laboratory supplies.
more
Quantification des intrants de santé : supplément SRMNI - Prévision de la consommation de produits sélectionnés pour la santé reproductive, maternelle, néonatale et infantile
JSI Research & Training Institute, Inc., et Management Sciences for Health
JSI Research & Training Institute, Inc., et Management Sciences for Health
(2016)
C1
Soumis à l’Agence des États-Unis pour le développement international par le programme SIAPS (Systems for Improved Access to Pharmaceuticals and Services ou Programme des systèmes pour l’amélioration de l’accès aux produits et services pharmaceutiques). Arlington, VA : Management Sciences
...
for Health. Soumis à l’UNICEF par JSI, Arlington, VA : JSI Research & Training Institute, Inc.
Ce guide aidera les gestionnaires de programmes, les prestataires de service et les experts techniques lorsqu'ils réaliseront une quantification des besoins en intrants pour les 13 produits indispensables à la santé reproductive, maternelle, néonatale et infantile, dont la priorité a été établie par la Commission des Nations Unies pour les produits qui sauvent la vie des femmes et des enfants. Ce supplément à la quantification ne saurait être utilisé sans son guide principal – Quantification of Health Commodities: A Guide to Forecasting and Supply Planning for Procurement (Quantification des intrants de santé : un guide pour la prévision des achats et la planification des approvisionnements). * Ce supplément décrit les étapes à suivre pour la prévision de la consommation de ces intrants, en l’absence de données sur la consommation ou les services. Ensuite, afin de compléter la quantification, les utilisateurs doivent se référer au guide principal de quantification pour l’étape de planification de l’approvisionnement.
more