Filter
2989
Text search:
USAID
Featured
162
1075
Language
2424
344
108
58
32
17
15
15
10
8
7
5
5
4
4
4
4
4
4
3
3
3
3
3
3
3
3
3
3
2
2
2
2
2
2
2
2
2
2
2
2
2
2
2
2
1
1
1
1
1
1
1
1
1
1
1
1
1
1
1
1
1
1
1
1
1
1
1
1
1
1
1
1
1
1
1
1
1
1
1
1
1
1
1
1
1
1
1
1
1
1
1
1
1
1
1
1
1
1
Document type
2170
314
189
108
55
49
33
23
21
12
8
4
2
1
Countries
144
110
108
94
92
90
84
80
79
78
77
60
59
56
49
48
48
47
43
41
41
40
40
35
34
34
33
30
28
28
27
27
25
25
25
20
18
18
18
17
15
12
12
11
11
10
10
8
8
8
8
7
7
6
6
6
6
6
6
5
5
5
5
5
4
4
4
3
3
3
3
3
2
2
2
2
2
2
2
2
2
2
2
2
2
2
2
1
1
1
1
1
1
1
1
1
1
1
1
1
1
1
1
1
1
1
1
1
1
1
1
1
1
1
1
1
1
Authors & Publishers
292
177
159
126
70
54
50
48
46
43
42
36
27
26
26
24
20
18
18
17
17
15
15
14
14
14
14
14
13
13
12
12
11
11
11
11
11
11
11
10
10
9
9
9
9
9
9
9
8
8
8
8
8
8
8
8
7
7
7
7
7
7
7
7
7
7
7
7
7
7
7
7
7
6
6
6
6
6
6
6
6
6
6
6
6
6
6
6
6
6
6
6
6
6
5
5
5
5
5
5
5
5
5
5
5
5
5
5
5
5
5
5
5
5
5
5
5
5
5
5
4
4
4
4
4
4
4
4
4
4
4
4
4
4
4
4
4
4
4
4
4
4
4
4
4
4
4
4
4
4
4
4
4
4
4
4
4
4
4
4
4
4
4
4
4
4
4
3
3
3
3
3
3
3
3
3
3
3
3
3
3
3
3
3
3
3
3
3
3
3
3
3
3
3
3
3
3
3
3
3
3
3
3
3
3
3
3
3
3
3
3
3
3
3
3
3
3
3
3
3
3
3
3
3
3
3
3
3
3
3
3
3
3
3
3
3
3
3
3
3
3
3
3
2
2
2
2
2
2
2
2
2
2
2
2
2
2
2
2
2
2
2
2
2
2
2
2
2
2
2
2
2
2
2
2
2
2
2
2
2
2
2
2
2
2
2
2
2
2
2
2
2
2
2
2
2
2
2
2
2
2
2
2
2
2
2
2
2
2
2
2
2
2
2
2
2
2
2
2
2
2
2
2
2
2
2
2
2
2
2
2
2
2
2
2
2
2
2
2
2
2
2
2
2
2
2
2
2
2
2
2
2
2
2
2
2
2
2
2
2
2
2
2
2
2
2
2
2
2
2
2
2
2
2
2
2
2
2
2
2
2
2
2
2
2
2
2
2
2
2
2
2
2
2
2
2
2
2
2
2
2
2
2
2
2
2
2
2
2
2
2
2
2
2
2
2
2
2
2
2
2
2
2
2
2
2
2
2
2
2
2
2
2
2
2
2
2
2
2
2
2
2
2
2
2
2
2
2
2
2
2
2
2
2
2
2
2
2
2
2
2
2
2
1
1
1
1
1
1
1
1
1
1
1
1
1
1
1
1
1
1
1
1
1
1
1
1
1
1
1
1
1
1
1
1
1
1
1
1
1
1
1
1
1
1
1
1
1
1
1
1
1
1
1
1
1
1
1
1
1
1
1
1
1
1
1
1
1
1
1
1
1
1
1
1
1
1
1
1
1
1
1
1
1
1
1
1
1
1
1
1
1
1
1
1
1
1
1
1
1
1
1
1
1
1
1
1
1
1
1
1
1
1
1
1
1
1
1
1
1
1
1
1
1
1
1
1
1
1
1
1
1
1
1
1
1
1
1
1
1
1
1
1
1
1
1
1
1
1
1
1
1
1
1
1
1
1
1
1
1
1
1
1
1
1
1
1
1
1
1
1
1
1
1
1
1
1
1
1
1
1
1
1
1
1
1
1
1
1
1
1
1
1
1
1
1
1
1
1
1
1
1
1
1
1
1
1
1
1
1
1
1
1
1
1
1
1
1
1
1
1
1
1
1
1
1
1
1
1
1
1
1
1
1
1
1
1
1
1
1
1
1
1
1
1
1
1
1
1
1
1
1
1
1
1
1
1
1
1
1
1
1
1
1
1
1
1
1
1
1
1
1
1
1
1
1
1
1
1
1
1
1
1
1
1
1
1
1
1
1
1
1
1
1
1
1
1
1
1
1
1
1
1
1
1
1
1
1
1
1
1
1
1
1
1
1
1
1
1
1
1
1
1
1
1
1
1
1
1
1
1
1
1
1
1
1
1
1
1
1
1
1
1
1
1
1
1
1
1
1
1
1
1
1
1
1
1
1
1
1
1
1
1
1
1
1
1
1
1
1
1
1
1
1
1
1
1
1
1
1
1
1
1
1
1
1
1
1
1
1
1
1
1
1
1
1
1
1
1
1
1
1
1
1
1
1
1
1
1
1
1
1
1
1
1
1
1
1
1
1
1
1
1
1
1
1
1
1
1
1
1
1
1
1
1
1
1
1
1
1
1
1
1
1
1
1
1
1
1
1
1
1
1
1
1
1
1
1
1
1
1
1
1
1
1
1
1
1
1
1
1
1
1
1
1
1
1
1
1
1
1
1
1
1
1
1
1
1
1
1
1
1
1
1
1
1
1
1
1
1
1
1
1
1
1
1
1
1
1
1
1
1
1
1
1
1
1
1
1
1
1
1
1
1
1
1
1
1
1
1
1
1
1
1
1
1
1
1
1
1
1
1
1
1
1
1
1
1
1
1
1
1
1
1
1
1
1
1
1
1
1
1
1
1
1
1
1
1
1
1
1
1
1
1
1
1
1
1
1
1
1
1
1
1
1
1
1
1
1
1
1
1
1
1
1
1
1
1
1
1
1
1
1
1
1
1
1
1
1
1
1
1
1
1
1
1
1
1
1
1
1
1
1
1
1
1
1
1
1
1
1
1
1
1
1
1
1
1
1
1
1
1
1
1
1
1
1
1
1
1
1
1
1
1
1
1
1
1
1
1
1
1
1
1
1
1
1
1
1
1
1
1
1
1
1
1
1
1
1
1
1
1
1
1
1
1
1
1
1
1
1
1
1
1
1
1
1
1
1
1
1
1
1
1
1
1
1
1
1
1
1
1
1
1
1
1
1
1
1
1
1
1
1
1
1
1
1
1
1
1
1
1
1
1
1
1
1
1
1
1
1
1
1
1
1
1
1
1
1
1
1
1
1
1
1
1
1
1
1
1
1
1
1
1
1
1
1
1
1
1
1
1
1
1
1
1
1
1
1
1
1
1
1
1
1
1
1
1
1
1
1
1
1
1
1
1
1
1
1
1
1
1
1
1
1
1
1
1
1
1
1
1
1
1
1
1
1
1
1
1
1
1
1
1
1
1
1
1
1
1
1
1
1
1
1
1
1
1
1
1
1
1
1
1
1
1
1
1
1
1
1
1
1
1
1
1
1
1
1
1
1
1
1
1
1
1
1
1
1
1
1
1
1
1
1
1
1
1
1
1
1
1
1
1
1
1
1
1
1
1
1
1
1
1
1
1
1
1
1
1
1
1
1
1
1
1
1
1
1
1
1
1
1
1
1
1
1
1
1
1
1
1
1
1
1
1
1
1
1
1
1
1
1
1
1
1
1
1
1
1
1
1
1
1
1
1
1
1
1
1
1
1
1
1
1
1
1
1
1
1
1
1
1
1
1
1
1
1
1
1
1
1
1
1
1
1
1
1
1
1
1
1
1
1
1
1
1
1
1
1
1
1
1
1
1
1
1
1
1
1
1
1
1
1
1
1
1
1
1
1
1
1
1
1
1
1
1
1
1
1
1
1
1
1
1
1
1
1
1
1
1
1
1
1
1
1
1
1
1
1
1
1
1
1
1
1
1
1
1
1
1
1
1
1
1
1
1
1
1
1
1
1
1
1
1
1
1
1
1
1
1
1
1
1
1
1
1
1
1
1
1
1
1
1
1
1
1
1
1
1
1
1
1
1
1
1
1
1
1
1
1
1
1
1
1
1
1
1
1
1
1
1
1
1
1
1
1
1
1
1
1
1
1
1
1
1
1
1
1
1
1
1
1
1
1
1
1
1
1
1
1
1
1
1
1
1
1
1
1
1
1
1
1
1
1
1
1
1
1
1
1
1
1
1
1
1
1
1
1
1
1
1
1
1
1
1
1
1
1
1
1
1
1
1
1
1
1
1
1
1
1
1
1
1
1
1
1
1
1
1
1
1
1
1
1
1
1
1
1
1
1
1
1
1
1
1
1
1
1
1
1
1
1
1
1
1
1
1
1
1
1
1
1
1
1
1
1
1
1
1
1
1
1
1
1
1
1
1
1
1
1
1
1
1
1
1
1
1
1
1
1
1
1
1
1
1
1
1
1
1
1
1
1
1
1
1
1
1
1
1
1
1
1
1
1
1
1
1
1
1
1
1
1
1
1
1
1
1
1
1
1
1
1
1
1
1
1
1
1
1
1
1
1
1
1
1
1
1
1
1
1
1
1
1
1
1
1
1
1
1
1
1
1
1
1
1
1
1
1
1
1
1
1
1
1
1
1
1
1
1
1
1
1
1
1
1
1
1
1
1
1
1
1
1
1
1
1
1
1
1
1
1
1
1
1
1
1
1
1
1
1
1
1
1
1
1
1
1
1
1
1
1
1
1
1
1
1
1
1
1
1
1
1
1
1
1
1
1
1
1
1
1
1
1
1
1
1
1
1
1
1
1
1
1
1
1
1
1
1
1
1
1
1
1
1
1
1
1
1
1
1
1
1
1
1
1
1
1
1
1
1
1
1
1
1
1
1
1
1
1
1
1
1
1
1
1
1
1
1
1
1
1
1
1
1
1
1
1
1
1
1
1
1
1
1
1
1
1
1
1
1
1
1
1
1
1
1
1
1
1
1
1
1
1
1
1
1
1
1
1
1
1
1
1
1
1
1
1
1
1
1
1
1
1
1
1
1
1
1
1
1
1
1
1
1
1
1
1
1
1
1
1
1
1
1
1
1
1
1
1
1
1
1
1
1
1
1
1
1
1
1
1
1
1
1
1
1
1
1
1
1
1
1
1
1
1
1
1
1
1
1
1
1
1
1
1
1
1
1
1
1
1
1
1
1
1
1
1
1
1
1
1
1
1
1
1
1
1
1
1
1
1
1
1
1
1
1
1
1
1
1
1
1
1
1
1
1
1
1
1
1
1
1
1
1
1
1
1
1
1
1
1
1
1
1
1
1
1
1
1
1
1
1
1
1
1
1
1
1
1
1
1
1
1
1
1
1
1
1
1
1
1
1
1
1
1
1
1
1
1
1
1
1
1
1
1
1
1
1
1
1
1
1
1
1
1
1
1
1
1
1
1
1
1
1
1
1
1
1
1
1
1
1
1
1
1
1
1
1
1
1
1
1
1
1
1
1
1
1
1
1
1
1
1
1
1
1
1
1
1
1
1
1
1
1
1
1
1
1
1
1
1
1
1
1
1
1
1
1
1
1
1
1
1
1
1
1
1
1
1
1
1
1
1
1
1
1
1
1
1
1
1
1
1
1
1
1
1
1
1
1
1
1
1
1
1
1
1
1
1
1
1
1
1
1
1
1
1
1
1
1
1
1
1
1
1
1
1
1
1
1
1
1
1
1
1
1
1
1
1
1
1
1
1
1
1
1
1
1
1
1
1
1
1
1
1
1
1
1
1
1
1
1
1
1
1
1
1
1
1
1
1
1
1
1
1
1
1
1
1
1
1
1
1
1
1
1
1
1
1
1
1
1
1
1
1
1
1
1
1
1
1
1
1
1
1
1
1
1
1
1
1
1
1
1
1
1
1
1
1
1
1
1
1
1
1
1
1
1
1
1
1
1
1
1
1
1
1
1
1
1
1
1
1
1
1
1
1
1
1
1
1
1
1
1
1
1
1
1
1
1
1
1
1
1
1
1
1
1
1
1
1
1
1
1
1
1
1
1
1
1
1
1
1
1
1
1
1
1
1
1
1
1
1
1
1
1
1
1
1
1
1
1
1
1
1
1
1
1
1
1
1
1
1
1
1
1
1
1
1
1
1
1
1
1
1
1
1
1
1
1
1
1
1
1
1
1
1
1
1
1
1
1
1
1
1
1
1
1
1
1
1
1
1
1
1
1
1
1
1
1
1
1
1
1
1
1
1
1
1
1
1
1
1
1
1
1
1
1
1
1
1
1
1
1
1
1
1
1
1
1
1
1
1
1
1
1
1
1
1
1
1
1
1
1
1
1
1
1
1
1
1
1
1
1
1
1
1
1
1
1
1
1
1
1
1
1
1
1
1
1
1
1
1
1
1
1
1
1
1
1
1
1
1
1
1
1
1
Publication Years
420
2287
275
7
Category
1585
211
158
123
102
69
29
4
Toolboxes
273
254
102
91
82
67
58
57
47
46
44
41
35
27
25
23
20
13
13
9
1
1
1
1
1
1
DHS Working Paper No. 136
A total of 1,222 children age 6-23 months were included in this analysis. Twenty percent of children were stunted and 43% were moderately anemic. Regarding IYCF practices, only 16% of children received a minimum acceptable diet, 25% received diverse food groups, 58% were ... fed with minimum meal frequency, 85% currently breastfed, and 59% consumed iron-rich foods. Breastfeeding reduced the odds of being stunted. By background characteristics, male sex, perceived small birth size, children of short stature, and children of working mother were significant predictors of stunting. Iron-rich food consumption was inversely associated with moderate anemia. Among covariates, male sex and maternal anemia were also significant predictors of moderate anemia among children age 6-23 months.
The study concluded that stunting and anemia among young children in Myanmar are major public health challenges that need urgent action. more
Submitted to the US Agency for International Development by the Systems for Improved Access to Pharmaceuticals and Services (SIAPS) Program. Arlington, VA: Management Sciences for Health. Submitted to the United Nations Children’s Fund by JSI, Arlington, VA: JSI Research & Training Institute, Inc.
...
This guide will assist program managers, service providers, and technical experts when conducting a quantification of commodity needs for the 13 reproductive, maternal, newborn, and child health commodities prioritized by the UN Commission on Life-Saving Commodities for Women and Children. This quantification supplement should be used with the main guide—Quantification of Health Commodities: A Guide to Forecasting and Supply Planning for Procurement. * This supplement describes the steps in forecasting consumption of these supplies when consumption and service data are not available; after which, to complete the quantification, the users should refer to the main quantification guide for the supply planning step.
more
Quantification des intrants de santé : supplément SRMNI - Prévision de la consommation de produits sélectionnés pour la santé reproductive, maternelle, néonatale et infantile
JSI Research & Training Institute, Inc., et Management Sciences for Health
JSI Research & Training Institute, Inc., et Management Sciences for Health
(2016)
C1
Soumis à l’Agence des États-Unis pour le développement international par le programme SIAPS (Systems for Improved Access to Pharmaceuticals and Services ou Programme des systèmes pour l’amélioration de l’accès aux produits et services pharmaceutiques). Arlington, VA : Management Sciences
...
for Health. Soumis à l’UNICEF par JSI, Arlington, VA : JSI Research & Training Institute, Inc.
Ce guide aidera les gestionnaires de programmes, les prestataires de service et les experts techniques lorsqu'ils réaliseront une quantification des besoins en intrants pour les 13 produits indispensables à la santé reproductive, maternelle, néonatale et infantile, dont la priorité a été établie par la Commission des Nations Unies pour les produits qui sauvent la vie des femmes et des enfants. Ce supplément à la quantification ne saurait être utilisé sans son guide principal – Quantification of Health Commodities: A Guide to Forecasting and Supply Planning for Procurement (Quantification des intrants de santé : un guide pour la prévision des achats et la planification des approvisionnements). * Ce supplément décrit les étapes à suivre pour la prévision de la consommation de ces intrants, en l’absence de données sur la consommation ou les services. Ensuite, afin de compléter la quantification, les utilisateurs doivent se référer au guide principal de quantification pour l’étape de planification de l’approvisionnement.
more
This guide provides national stakeholders and advocates with information and guidance to update the national essential medicines list to include a new commodity, a new indication, or a new formulation based on the available evidence and based on country need and disease burden. While the actors, tim
...
eline, and process may vary from country to country, this guide presents the broad steps involved in revising an EML for any health commodity. Additional resources and a glossary are included to provide supplemental information and to clarify key terms.
more
Women and Health Initiative Working Paper No. 1. Women and Health Initiative
Improving maternal health in the context of the sub-Saharan African HIV epidemic requires greater understanding of the relationships between HIV disease and maternal morbidity and mortality, integrated and effective resp ... onses by the health system, and a social context which promotes quality care and encourages use of MCH and HIV services. Advancing the proposed research agenda will make an invaluable contribution by generating needed evidence for policy and practice that improves the maternal health of women who are living with HIV, as well as those who are not. Bringing together maternal health and HIV researchers, policy-makers and program implementers to reduce HIV-related maternal morbidity and mortality and improve the HIV response for women represents an opportunity and a challenge. more
Improving maternal health in the context of the sub-Saharan African HIV epidemic requires greater understanding of the relationships between HIV disease and maternal morbidity and mortality, integrated and effective resp ... onses by the health system, and a social context which promotes quality care and encourages use of MCH and HIV services. Advancing the proposed research agenda will make an invaluable contribution by generating needed evidence for policy and practice that improves the maternal health of women who are living with HIV, as well as those who are not. Bringing together maternal health and HIV researchers, policy-makers and program implementers to reduce HIV-related maternal morbidity and mortality and improve the HIV response for women represents an opportunity and a challenge. more
National Tuberculosis Programme
The National Strategic Plan (NSP) for Tuberculosis (TB) 2016-2020 builds on the past experiences for the National Tuberculosis Programme and its partners. This NSP provides a roadmap for delivering quality TB prevention and care service to the entire population, ... as an integral part of the country's move toward Universal Health Coverage. Between 1990 and 2015, Myanmar reduced the prevalence of TB by 50%, meeting the targets set by the Millennium Development Goals. Going forward, the country aims to further accelerate the rate decline. more
The National Strategic Plan (NSP) for Tuberculosis (TB) 2016-2020 builds on the past experiences for the National Tuberculosis Programme and its partners. This NSP provides a roadmap for delivering quality TB prevention and care service to the entire population, ... as an integral part of the country's move toward Universal Health Coverage. Between 1990 and 2015, Myanmar reduced the prevalence of TB by 50%, meeting the targets set by the Millennium Development Goals. Going forward, the country aims to further accelerate the rate decline. more
National Tuberculosis Programme and Senior Paediatricians
This guideline was first developed in 2007 but further updated in 2012 and 2016 to ensure the use of the latest evidence-based international recommendations on childhood TB. The guidelines will fill the gaps in a systematic approach to T ... B in children and will help to achieve an internationally recommended standard of care at all levels of the health system in Myanmar. more
This guideline was first developed in 2007 but further updated in 2012 and 2016 to ensure the use of the latest evidence-based international recommendations on childhood TB. The guidelines will fill the gaps in a systematic approach to T ... B in children and will help to achieve an internationally recommended standard of care at all levels of the health system in Myanmar. more
Climate change is a growing concern for Bangladesh because 90 percent of the country is approximately 10 feet above sea level. An evaluation was completed which discovered that high tides in Bangladesh were increasing 10 times more rapidly than the global average. This predicted rapid increase in se
...
a levels places Bangladesh four times higher than the global average. By 2050, approximately 20 percent of the inhabited land in Bangladesh will be inundated by the sea resulting in displacement for nearly 20 million people. The Government of Bangladesh has implemented policies and plans to focus on climate change concerns, but there is still much work to be completed.
Bangladesh is a nation which will continue to experience the devastating effects of climate change. These concerns for the nation are recognized and the Government of Bangladesh is working progressively to implement mitigation and preparedness measures along with making national economic and transportation improvements to better sever and protect the people of Bangladesh. more
Bangladesh is a nation which will continue to experience the devastating effects of climate change. These concerns for the nation are recognized and the Government of Bangladesh is working progressively to implement mitigation and preparedness measures along with making national economic and transportation improvements to better sever and protect the people of Bangladesh. more
Version-1, June 2018
This document provides 3MDG stakeholders with essential information on SRHR indicators, derived from the 3MDG Logical Framework, Data Dictionary for Health Service Indicators (2014 June, DoPH, MoHA), A Guide to Monitoring and Evaluating Adolescent Reproductive Health Progra ... ms (MEASURE Evaluation, June 2000) and Monitoring National Cervical Cancer Prevention and Control Programmes (WHO, PAHO, 2013). Partners are strongly encouraged to integrate the SRHR indicators into their ongoing monitoring and evaluation (M&E) activities.
These indicators are designed to help partners assess the current state of their activities, their progress towards achieving their targets, and contribution towards the national response. This guideline is designed to improve the quality and consistency of data collected at the township level, which will enhance the accuracy of conclusions drawn when the data are aggregated. more
While the world was gripped by the unfolding COVID-19 pandemic in 2020, children continued to face the same crisis they have for decades: intolerably high mortality rates and vastly inequitable chances at life. In total, more than 5.0 million children under age 5, including 2.4 million newborns, alo
...
ng with 2.2 million children and youth aged 5 to 24 years – 43 per cent of whom are adolescents – died in 2020. This tragic and massive loss of life, most of which was due to preventable or treatable causes, is a stark reminder of the urgent need to end preventable deaths of children and young people.
more
The main purpose of the training package is to develop the minimum skills and knowledge required by personnel involved in wheelchair service delivery. An important aim of the training package is to get it integrated into the regular paramedical/rehabilitation training programs such as physiotherapy,
...
occupational therapy, prosthetics and orthotics, rehabilitation nursing. Towards this, WHO is posting the whole training package in the Website for the training institutes and wheelchair service providers. The easiest way to make use of the training package is to download the complete package (requires 3 GB space).
more
Le module de formation de niveau élémentaire est conçu pour soutenir la formation du personnel ou des bénévoles dans le but de fournir un fauteuil roulant manuel et un coussin adaptés aux filles, garçons, femmes et hommes qui ont une mobilité réduite, mais peuvent se tenir assis sans soutie
...
n postural supplémentaire. Le but du cahier du participant est de développer les compétences et les connaissances du personnel impliqué dans la prestation de services de fauteuils roulants. Le cahier du participant contient des exercices qui aideront à tester et à développer les connaissances et les compétences des participants. Il contient des documents provenant de cours magistraux, de diaporamas et du manuel de référence ; il est prévu que les participants conservent leur exemplaire pour pouvoir s’y référer ultérieurement, si nécessaire.
more
El paquete de capacitación de nivel básico fue pensado para apoyar la capacitación del personal o los voluntarios, para que suministren sillas de ruedas manuales y cojines apropiados a los niños, niñas, hombres y mujeres que tienen problemas de movilidad pero pueden sentarse erguidos sin apoyo
...
postural adicional. El propósito del Cuaderno del participante es desarrollar las habilidades y los conocimientos del personal que presta servicios de sillas de ruedas. El Cuaderno del participante contiene ejercicios que ayudarán a los participantes a practicar y desarrollar sus habilidades y conocimientos. El Cuaderno del participante contiene material de las lecciones, las presentaciones de diapositivas y el manual de referencia. Se recomienda a los participantes que conserven su cuaderno para usar como referencia futura.
more
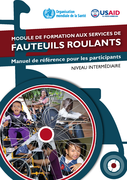
Le module de formation de niveau intermédiaire vise à soutenir la formation de personnel ou de volontaires, afin de fournir un fauteuil roulant manuel et un coussin appropriés aux filles, garçons, femmes et hommes qui nécessitent un soutien postural supplémentaire pour être en
mesure de se t
...
enir assis droit.
more
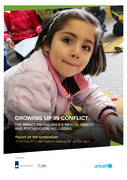
Growing Up in Conflict: The Impact on Children's Mental Health and Psychosocial Well-being
Maria Bray, Sabine Rakotomalala, Leslie Snider, Saji Thomas
UNICEF, Wendy Ager, Pierette James
(2015)
Report on the symposium 26–28 May 2015, New Babylon Meeting Center, The Hague
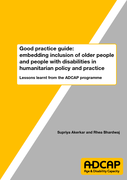
Lessons learnt from the ADCAP programme | This guide shares good practices and challenges that have emerged through the experience of the Age and Disability Capacity Programme (ADCAP) implementing partners, in embedding inclusion of older people and people with disabilities within their humanitaria
...
n policies and practices. All mainstream and specialist organisations engaged in humanitarian responses can learn and benefit from this experience. This guide complements the ‘Humanitarian inclusion standards for older people and people with disabilities’ (see Appendix 4), by documenting practices that will help humanitarian organisations to systematically include older people and people with disabilities.
more
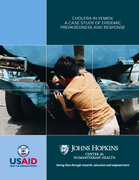
The report offers 20 top recommendations for getting ahead of future outbreaks in Yemen and similarly complex humanitarian settings.
In 2015, Yemen was declared a Level 3 emergency by the UN, kicking into gear the highest level of humanitarian support. A massive cholera outbreak followed, leading t
...
o 1 million suspected cases in 2 waves from September 2016-July 2018.
“We largely know ‘what to do’ to control cholera, but context-specific practices on ‘how to do it’ in order to surmount challenges to coordination, logistics, insecurity, access and politics remain needed,” the report states.
While the response improved between the 2 waves, there were gaps. For one, Yemen’s history of cholera should have triggered a heavy focus on pre-planning for an epidemic, such as stockpiling supplies and doubling down on community-based surveillance, the report fou
more
IK Notes No. 10 July 1999 | IK Notes reports periodically on Indigenous Knowledge (IK) initiatives in Sub-Saharan Africa. It is published by the Africa Region's Knowledge and Learning Center as part of an evolving IK partnership between the World Bank, communities, NGOs, development institutions and
...
multilateral organizations. T
more