Filter
3060
Text search:
household
survey
Featured
186
1076
Language
Document type
2074
543
155
111
77
37
30
21
5
4
3
Countries
144
127
111
111
97
96
91
88
85
83
81
76
68
64
63
61
59
56
42
40
38
36
36
36
35
35
35
32
31
29
28
24
22
22
20
20
20
17
15
15
14
14
13
13
13
13
13
11
11
10
10
9
9
8
8
7
7
7
6
6
6
6
5
5
5
5
5
4
4
4
4
4
4
3
3
3
3
3
3
3
2
2
2
2
2
2
2
2
2
2
2
2
2
2
2
2
1
1
1
1
1
1
1
1
1
1
1
1
1
1
1
1
1
1
1
1
1
1
1
1
1
1
1
1
1
1
1
1
1
Authors & Publishers
Publication Years
Category
1691
148
142
125
107
31
9
3
Toolboxes
189
179
155
154
120
110
108
68
62
47
46
45
37
33
33
32
20
17
17
15
11
2
2
2
1
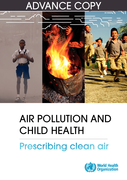
This report summarizes the latest scientific knowledge on the links between exposure to air pollution and adverse health effects in children. It is intended to inform and motivate individual and collective action by health care professionals to prevent damage to children’s health from exposure to
...
In this paper they make estimates of the potential short-term economic impact of COVID-19 on global monetary poverty through contractions in per capita household income or consumption.
The estimates are based on three scenarios: low, medium, and
...
Bull World Health Organ 2020;98:773–780
Universal health coverage (UHC) depends on a strong primary health-care
system. To be successful, primary health care must be expanded at community and household levels as much of the world’s populatio
...
A module from the suite of health service capacity assessments in the context of the COVID-19 pandemicINTERIM GUIDANCE5 February2021
The Community needs, perceptions and demand: community assessment toolcan be used by countries to conduct a rapid pulse su
...
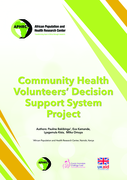
This report presents the key findings of the end-of-project assessment of households and
community health volunteers, conducted in 2017 in the Kamukunji and Embakasi sub-counties
of Nairobi, Kenya, for a Community Health Volunteers’ Decision Support System (CHV DSS)
intervention project. The re
...
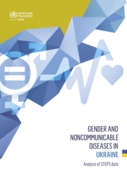
This report is part of the gender and noncommunicable diseases (NCDs) initiative launched by the WHO Regional Office for Europe, which aims to strengthen the response to NCDs through a gender approach. It is part of a series of country profiles and a synthesis report. The country profile of Ukraine
...
7 April 2022. Aimed at national policymakers, public health and healthcare planners, staff working in reception centres, and healthcare staff caring for displaced persons, the information note concludes that universal testing of incoming refugees from Ukraine for tuberculosis (TB) infection is not r
...
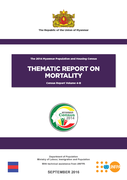
Census Report Volume 4-B
In the 2014 Census, early-age mortality was measured from the responses to two simple retrospective questions on childbearing addressed to ever-married women aged 15 and over. These questions referred to how many live children they had ever given birth to, and how many ...
In the 2014 Census, early-age mortality was measured from the responses to two simple retrospective questions on childbearing addressed to ever-married women aged 15 and over. These questions referred to how many live children they had ever given birth to, and how many ...
Study Report August 2014
Curatio International Foundation (CIF) and the Association Tanadgoma would like to acknowledge the financial support provided by GFATM under the project “Establishment of evidence base for national HIV/AIDS program by strengthening of HIV/AIDS surveillance system in t
...
WHO Guideline. Since 2010, countries in the meningitis belt have started to introduce a new serogroup A meningococcal conjugate vaccine conferring individual protection and herd immunity. Following the successful roll-out of this vaccine, epidemics due to Neisseria meningitidis serogroup A (NmA) are
...

Second interim report to the SMAC program, DFID Freetown
This report provides further output from an anthropological study of 25 villages affected by Ebola Virus Disease in eastern and central Sierra Leone, undertaken as part of the DFID-funded social mobilization initiative for Ebola prevention in
...
The COVID-19 HEalth caRe wOrkErs Study (HEROES): Regional Report from the Americas is a multicenter prospective cohort study to assess the impact of the COVID-19 pandemic on the mental health of health care workers in 26 countries on four continents and how it is affected by several factors at diffe
...
DHS Further Analysis Reports No. 111
This study is a theory-driven analysis of the socio-demographic determinants of maternal care seeking in Kenya. Specifically, it examines predisposing, enabling, and need factors potentially associated with use of antenatal care (ANC), health facility delive ...
This study is a theory-driven analysis of the socio-demographic determinants of maternal care seeking in Kenya. Specifically, it examines predisposing, enabling, and need factors potentially associated with use of antenatal care (ANC), health facility delive ...
The Facilitator's Guide has been piloted in Borno (Nigeria) and in Fafan zone (Somali region, Ethiopia) and improved iteratively after each test.
What does the ROAP have that you won't find in other methodologies?
It is based on holistic, people-centred approaches that span across sectors an
...
This year’s MPI results show that more than two-thirds of the multidimensionally poor—886 millionpeople—live in middle-income countries. A further 440 million live in low-income countries. In both groups, data show, simple national averagescan hide enormous inequality inpatterns of povertywith
...

Global actions to reduce antimicrobial resistance (AMR) include optimising the use of antimicrobial medicines in human and animal health. In countries with weak healthcare regulation, this requires a greater understanding of the drivers of antibiotic use from the perspective of providers and consume
...
This study is a theory-driven analysis of the socio-demographic determinants of maternal care seeking in Kenya. Specifically, it examines predisposing, enabling, and need factors potentially associated with use of antenatal care (ANC), health facility delivery, and timely postnatal care (PNC).This s
...
In Kenya, 12.7 percent of sick Kenyans do not seek health care when they are ill with high cost of services being one of the major barriers that accounted for upto 21 percent of those who did not seek care in 2013. Further, 2.6 million Kenyans (6.2 percent) of households were at risk of impoverishme
...
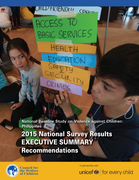
The coronavirus disease 2019 (COVID-19) pandemic has created a global and gendered crisis that is compounding existing inequalities and disproportionately affecting girls and women. Emerging evidence from the COVID-19 crisis in 2020 shows school closures, disruptions in essential services and rising
...
Noncommunicable diseases (NCDs) are the principal cause of morbidity, disability and premature mortality in Azerbaijan. The most effective way to reduce the NCD burden is to prevent NCD development, by addressing thebehavioural risk factors underlying NCDs at the population and individual leve
...
COVID-19 vaccine hesitancy is currently one of the main obstacles to worldwide herd immunity and socioeconomic recovery. Because vaccine coverage can vary between and within countries, it is important
to identify sources of variation so that policies can be tailored to different population groups.
...
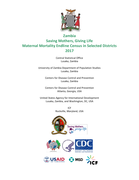
As a lower-middle-income country (LMIC), South Africa (SA) bears
the burden of maternal and neonatal mortality similar to other sub-
Saharan African countries. According to the Saving Mothers Report
2017/19, there has been a progressive and sustained reduction
in institutional maternal mortality
...
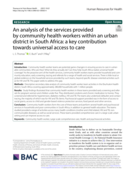
Community health worker teams are potential game-changers in ensuring access to care in vulnerable communities. Who are they? What do they actually do? Can they help South Africa realize universal health coverage? As the proactive arm of the health services, community health workers teams provide
...
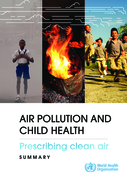
This report summarizes the latest scientific knowledge on the links between exposure to air pollution and adverse health effects in children. It is intended to inform and motivate individual and collective action by health care professionals to prevent damage to children’s health from exposure to
...
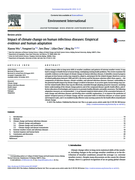
Environment International Volume 86, January 2016, Pages 14-23
Climate change refers to long-term shifts in weather conditions and patterns of extreme weather events. It may lead to changes in health threat to human beings, multiplying existing health problems. This review examines the scientific e
...
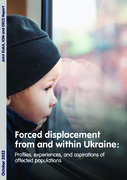
Joint EUAA, IOM and OECD report provides new insights on displacement from and within Ukraine
The European Union Agency for Asylum (EUAA), the International Organization for Migration (IOM) and the Organisation for Economic Co-operation and Development (OECD) have published a Joint Report on profil
...
Cholera which disproportionally impacts poor countries and the most vulnerable continues to affect at least 47 countries across the globe, resulting in an estimated 1.3 – 4 million cases, and 21,000 - 143,000 deaths per year worldwide. In Ethiopia, despite major improvements seen in the increasing
...
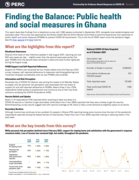
To enhance health co-benefits across urban policies which tackle air pollution and climate change, WHO, in cooperation with various international, national, and local partners, implemented the Urban Health Initiative (UHI) pilot project in Accra, Ghana. The Initiative prompted the health sector to u
...
Each humanitarian setting provides distinct opportunities and challenges for actors to coordinate and collaborate at strategic and operational levels. The Health and Protection Joint Operational Framework has been developed to ensure that the health and protection response during humanitarian emerge
...
The Democratic Republic of Timor-Leste has the highest TB incidence rate in the South East Asian Region - 498 per 100,000, which is the seventh highest in the world. In Timor-Leste TB is the eighth most common cause of death.
The salient observations are as follows:
In 2018, 487 (12.5%) of the
...
Air pollution is one of the leading causes of health complications and mortality worldwide, especially affecting lower-income groups, who tend to be more exposed and vulnerable. This study documents the relationship between ambient air pollution exposure and poverty in 211 countries and territories.
...
Children malnutrition eradication in developing countries is a real challenge, especially among
vulnerable population. There are so many effort towards women (who are the main care providers)
socio-economic situation in order to improve their children nutrition. This article aims to identify the
...
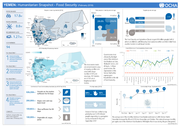
Humanitarian crises exacerbate nutritional risks and often lead to an increase in acute malnutrition. Emergencies include both manmade (conflict) and natural disasters (floods, drought, cyclones, typhoons, earthquakes, volcanic eruptions, etc.). Complex emergencies are combinations of both manmade a
...
This report presents further analysis of the 2015 Nepal Health Facility Survey. Data analysis is based on the Donabedian framework for assessing quality of care in health services, which divides the indicators into three groups: structure, process,
...
Results of the humanitarian needs assessment in the Kharkiv region - Winter period October 8-10, 2022
91 in-person surveys of heads of household, 91 households, 245 adult household members, 76 mino
...
Module on child functioning
recommended
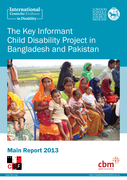
The Washington Group/UNICEF Module on Child Functioning, finalized in 2016, covers children between 2 and 17 years of age and assesses functional difficulties in different domains including hearing, vision, communication/comprehension, learning, mobility and emotions. To better reflect the degree of
...

DHS Working Papers No. 101
Women’s empowerment, HIV testing, birth in past five years, Tanzania
Zambia Report for 2017
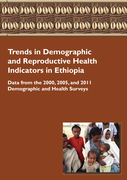
Data from the 2000, 2005, and 2011 Demographic and Health Surveys. DHS Trend Reports No. 7
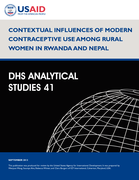
DHS Analytical Studies No. 41
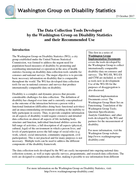
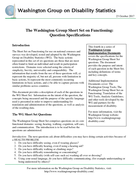
This first in a series of Washington Group Implementation Documents covers the tools developed by the Washington Group to collect
internationally comparable disability data on censuses and surveys. WG Implementation guideline Tool 1
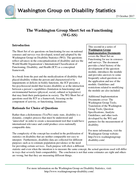
WG Implementation Guidelines Tool2
ESCAP Project on improving disability measurement and statistics in the Asia Pacfic Region
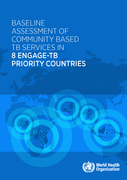
This document contains a series of desk reviews for the eight ENGAGE-TB priority countries supported by the Global Fund (DRC, Kenya, Indonesia, Mozambique, Myanmar, Nigeria, Pakistan and Tanzania). The document provides a situation assessment and gap analysis about the state of community based TB ac
...


DHS Working Papers No. 91
Further Analysis of the 2000, 2005, and 2011 Demographic and Health Surveys. DHS Further Analysis Reports No. 81
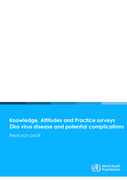
This is a resource pack for a Knowledge, Attitudes and Practices (KAP) surveys about Zika virus and its suspected complications such as microcephaly and Guillain-Barré syndrome.
This resource and associated advice was requested by governments and response partners as a way to rapidly obtain valuab
...
Further Analysis of the 2000, 2005, and 2011 Demographic and Health Surveys. DHS Further Analysis Reports No. 79

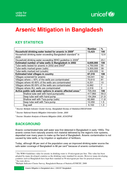
Arsenic contaminated tube well water was first detected in Bangladesh in early 1990s. The arsenic comes from naturally arsenic-rich material delivered by the region's river systems, deposited over many years to make up the land of Bangladesh. Arsenic contamination is not caused by tube wells, or by
...
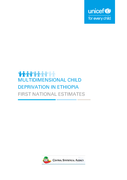
The report studied child poverty in nine dimensions – development/stunting, nutrition, health, water, sanitation, and housing. Other dimensions included education, health related knowledge, and information and participation.
An estimated 36 million of a total population of 41 million children und
...
As of September 2022, just over one million forced
migrants from Ukraine have entered Germany, making Germany the third largest recipient of migrants
(Ukraine Refugee Situation, 2022).
As early as March 2022, several news outlets reported that accommodation centers were at or near
capacity in ma
...
Malawi Internationally recommended key policies uptake
Further Analysis of the 2000, 2005, and 2011 Demographic Health Surveys. DHS Further Analysis Reports No. 72
The substantial burden of death and disability that results from interpersonal violence, road traffic injuries, unintentional injuries, occupational health risks, air pollution, climate change, and inadequate water and sanitation falls disproportionally on low- and middle-income countries. Injury Pr
...
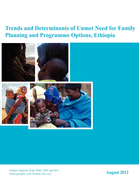
DHS Working Papers No. 94 - This study described the family planning initiatives in Rwanda and analyzed the 2005 and 2010 RDHS data to identify factors that contribute to the increase in contraceptive use. The Blinder-Oaxaca technique was used to decompose the contributions of women’s characterist
...
Census Report Volume 4-C
The 2014 Myanmar Census provided the opportunity to measure maternal mortality. The questions on deaths in households during the twelve months prior to the Census were included in the questionnaire, as well as questions necessary to estimate maternal mortality indicator ...
The 2014 Myanmar Census provided the opportunity to measure maternal mortality. The questions on deaths in households during the twelve months prior to the Census were included in the questionnaire, as well as questions necessary to estimate maternal mortality indicator ...

Lancet Oncol 2018 Published Online September 12, 2018 http://dx.doi.org/10.1016/S1470-2045(18)30447-9
This report addresses the impact of emergency shelter programs in the development of post-relief economies and in building incomes of affected populations. It provides a review and analysis of the available literature relevant to understanding the economic impact of emergency shelter programs, addit
...

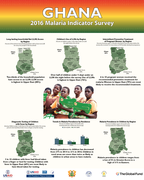
map/infographic

UNICEF’s support for data collection: the Multiple Indicator Cluster Surveys (MICS)
WG Implementation Guidelines Tool 4
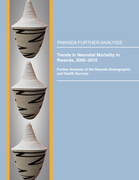
DHS Further Analysis Reports No. 88 - This further analysis examines levels, trends, and determinants of neonatal mortality in Rwanda, using data from the 2000, 2005, and 2010 Rwanda Demographic and Health Surveys (RDHS).
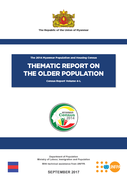
Census Report Volume 4-L
Myanmar’s 2014 Census enumerated 4.5 million people aged 60 and over and by 2050 Myanmar is projected to have 13 million people in this age group.
Myanmar’s population has aged between 1973 and 2014; while the total population increased at an annual rate of 1. ...
Myanmar’s 2014 Census enumerated 4.5 million people aged 60 and over and by 2050 Myanmar is projected to have 13 million people in this age group.
Myanmar’s population has aged between 1973 and 2014; while the total population increased at an annual rate of 1. ...
Ghana is attracting global attention for efforts to provide health insurance to all citizens through the National Health Insurance Scheme (NHIS). With the program’s strong emphasis on maternal and child health, an expectation of the program is that members will have increased use of relevant servi
...