Filter
2081
Text search:
demographic
and
social
indicators
Featured
107
794
Language
Document type
1461
344
107
68
61
12
10
9
3
2
2
1
Countries
108
92
92
82
76
70
68
66
63
61
57
57
53
49
46
40
38
37
34
29
27
26
26
26
25
21
20
17
16
16
15
14
14
12
12
11
10
10
10
9
9
9
8
8
8
7
7
7
6
6
5
5
5
5
5
4
4
4
4
4
4
4
3
3
3
3
3
3
3
3
3
3
3
3
2
2
2
2
2
2
2
2
2
2
1
1
1
1
1
1
1
1
1
1
1
1
1
1
1
1
1
1
1
1
1
1
1
1
1
1
1
1
1
1
1
Authors & Publishers
Publication Years
Category
1260
109
103
71
63
13
4
4
Toolboxes
135
97
76
75
66
65
41
37
24
24
23
22
19
19
16
15
11
9
8
6
2
2
1
DHS Further Analysis Reports No. 88 - This further analysis examines levels, trends, and determinants of neonatal mortality in Rwanda, using data from the 2000, 2005, and 2010 Rwanda
...
This research report provided results from the study of living conditions among people with functional limitation in Mozambique. Two comparative studies of different indicators of living conditions were carried out. These studies include: (i) a comp
...
This report presents the key findings of the NFHS-5 in West Bengal, followed by detailed tables and an appendix on sampling errors. At the time of finalization of this report, wealth quintiles for the country as a whole were not ready. Therefore, on
...
This year’s MPI results show that more than two-thirds of the multidimensionally poor—886 millionpeople—live in middle-income countries. A further 440 million live in low-income countries. In both groups, data show, simple national averagescan hide enormous inequality inpatterns of povertywith
...
Summary Report on the Comprehensive Study
This study is made possible by the generous support of the American people through the United States Agency for International Development (USAID). The contents are the responsibility of their authors and
...
The Zimbabwe National Pharmacovigilance Policy Handbook, 2nd Edition updates the November 2013 version to indicate the Zimbabwe National Pharmacovigilance (PV) Centre’s compliance with the WHO Pharmacovigilance Indicators Handbook 2015.
The National Strategic Plan is based on the following guiding principles:
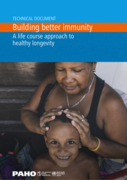
1) Life-course approach: adolescence is a key decade in the course of life that influences the health outcomes later in life.
2) Comprehensive approach: It recognizes the cross cutting health ...
1) Life-course approach: adolescence is a key decade in the course of life that influences the health outcomes later in life.
2) Comprehensive approach: It recognizes the cross cutting health ...
Community health worker teams are potential game-changers in ensuring access to care in vulnerable communities. Who are they? What do they actually do? Can they help South Africa realize universal health coverage? As the proactive arm of the health services, community health workers teams provide ho
...
Indicators for monitoring the 2016 United Nations Political Declaration on Ending AIDS
UNAIDS supports countries to collect information on their national HIV responses through the Global AIDS Monitoring (GAM) framework—an annual collection of ...
UNAIDS supports countries to collect information on their national HIV responses through the Global AIDS Monitoring (GAM) framework—an annual collection of ...
Promoting and protecting health is essential to human welfare and sustained economic and social
...
A toolkit for behavioural and social communication in outbreak response
The report discusses the epidemiological and social aspects of ageing, health and functional changes experienced with ageing, the impact of physica
...
Towards Sustainable Community Health and Social Welfare Services
Leaving No One Behind. This Operational Guideline for Community-Based Health Services (CBHS)
in line with the CBHS Policy Guideline
...
As the Americas undergo profound demographic change and there are more persons aged 65 years or older than children younger than 5 years, it is crucial to recognize that national immunization progra
...
Notable progress has also been made on other key health indicators such as reducing maternal, infant and child deaths and malnutrition, increasing
...
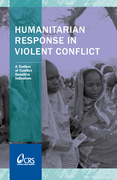
Humanitarian Response in Violent Conflict
recommended
A Toolbox of Conflict Sensitive Indicators.
This toolbox adapts a sample of 15 indicators from the SPHERE Project's Humanitarian Charter and Minim
...
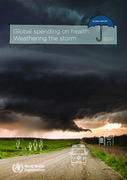
The 2020 Report analyzes global health spending for 190 countries from 2000 to 2018 and provides insights as to the health spending trajectory from the MDG era to the SDG era prior to the crisis of 2020. The report shows that global spending on heal
...
The World Cities Report 2020 shows that the intrinsic value of sustainable urbanization can and should be harnessed for the wellbeing of all. The Report provides evidence and policy analysis of the
...
USAID/KENYA Evaluation Services and Program Support (ESPS)
The United States Agency for International Development (USAID) has a solid track record of supporting health and development initiativ ...
The United States Agency for International Development (USAID) has a solid track record of supporting health and development initiativ ...
Joint data assessment by the Central Statistical Organization and UNDP
The report shows that the National Statistical System of Myanmar has some work ahead of it in terms of preparing for the monitoring of the SDG ...
The report shows that the National Statistical System of Myanmar has some work ahead of it in terms of preparing for the monitoring of the SDG ...
The World health statistics report is the annual compilation of health and health-related indicators which has been published by the World Health Organization (WHO) since 2005. The 2023 edition revi
...
Humanitarian crises exacerbate nutritional risks and often lead to an increase in acute malnutrition. Emergencies include both manmade (conflict) and natural disasters (floods, drought, cyclones, ty
...
Global Biodiversity Outlook (GBO) is the flagship publication of the Convention on Biological Diversity (CBD). It is a periodic report that summarizes the latest data on the status and trends of biodiversity
...
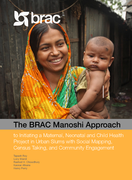
To Initiating a Maternal, Neonatal and Child Health Project in Urban Slums with Social Mapping, Census Taking, and Community Engagement
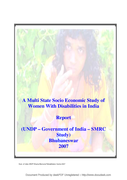
The study analyses the intersection of gender with disability issues by combining economic and social analysis across four states in India by using both quantitative
...
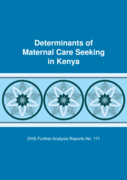
This study is a theory-driven analysis of the socio-demographic determinants of maternal care seeking in Kenya. Specifically, it examines predisposing, enabling, and need factors potentially associa
...
With a focus on Pakistan and Nigeria’s most vulnerable communities, this report provides insight about the role that community push-back is playing in the transmission of the polio virus and how t
...
The attainment of Zambia’s goal of being a prosperous and middle-income country by 2030 as stipulated in its Vision 2030 is dependent on among others, a healthy and productive population. Therefor
...
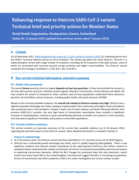
This document aims to describe a minimum set of surveillance activities recommended at the national level to detect and monitor the relative prevalence of SARS-CoV-2 variants and outline a set of ac
...
The Republic of the Union of Myanmar is at a historic moment, with a new civilian government assuming power in 2016. The country graduated to lower-middle-income status in 2015, and has made significant progress in reducing poverty, improving food s
...
(August 28 – October 10, 2017)
A nutrition and mortality assessment using SMART methodology was applied and the survey covered 15 statistical (14 districts plus 1) domains countrywide. The ma ...
A nutrition and mortality assessment using SMART methodology was applied and the survey covered 15 statistical (14 districts plus 1) domains countrywide. The ma ...
The report presents the latest data on more than 50 health-related Sustainable Development Goal and "triple billion" target indicators. The 2021 edition includes preliminary estimates for global exc
...
DHS Further Analysis Reports No. 111
This study is a theory-driven analysis of the socio-demographic determinants of maternal care seeking in Kenya. Specifically, it examines predisposing, enabling, a ...
This study is a theory-driven analysis of the socio-demographic determinants of maternal care seeking in Kenya. Specifically, it examines predisposing, enabling, a ...
This year marked the beginning of the WHO biennium 2016-2017 action plan; this annual report highlights WHO’s key achievements in 2016
It also documents the extraordinary efforts by a broad coalition of government ministries, municipalities, international agencies, community groups, women’s or
...
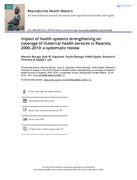
From 2000 to 2010, Rwanda implemented comprehensive health sector reforms to strengthen the public health system, with the aim of reducing maternal and newborn deaths in line with Millennium Development Goal 5, among many other improvements in natio
...
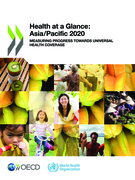
Measuring progress towards universal health coverage.
This sixth edition of Health at a Glance Asia/Pacific presents a set of key indicators of health status, the determinants of health, health care resources
...
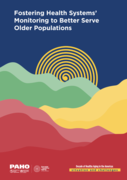
The chapter Fostering Health Systems’ Monitoring to Better Serve Older Populations is part of the publication series entitled Decade of Healthy Aging: Situation and Challenges. The publications are designed to favor the prioritization of effective
...
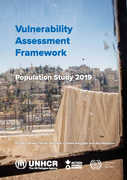
This study provides information about vulnerabilities within the targeted population and contributes to reflection within UNHCR on how to interpret their multisectorial Home Visit assessments. By exploring relationships between vulnerability
...
Safe sanitation is essential for health, from preventing infections to improving and maintaining mental and social
well-being. Lack of adequate sa
...
21 January 2022
The overall threat posed by Omicron largely depends on four key questions: (i) how transmissible the variant is; (ii) how well vaccines and prior infection protect against infection, transmission, clinical disease
...
This Eye health strategic plan presents the Ministry of Health’s five
year proposed strategies for eye care in Kenya. It sets the strategic
direction for the National Eye Health Care System and presents
information on the priorities, objectives
...
The Sendai Framework for Disaster Risk Reduction 2015-2030 outlines seven clear targets and four priorities for action to prevent new and reduce existing disaster risks: (i) Understanding disaster r
...
This document adopts a health determinants framework for examining the evidence related to women’s poor mental health. From this perspective, public policy including economic policy, socio-cultural and environmental factors, community
...
This report presents three scenarios on the impact of COVID-19 in Africa using economic growth forecasts, mortality and efforts to ameliorate impact through social grants. Likely effects are examine
...

Mental health issues are usually given very low priority in health service policies. Although this is changing, African countries are still confronted with so many problems caused by communicable diseases and malnutrition that they have not woken up
...
An estimated 1.3 billion people globally experience significant disability. This figure has grown over the last decade and will continue to rise due to demographic
...
Because of the limited access to more powerful diagnostic tools, there is a paucity of data regarding the burden of fungal infections in Burkina Faso. The aim of this study was to estimate the incidence and prevalence of serious fungal infections in
...

New assessment guidelines for measuring the overall impact of mental health problems in Latin America have served as a catalyst for countries to review their mental health policies. Latin American countries have taken various steps to address long-standing problems such as structural difficulties, s
...
Six months in, the indirect impacts of COVID-19 take a toll on health, social and economic outcomes.
This is the third guidance note in a four-part series of notes related to impact evaluation developed by InterAction with financial support from the Rockefeller Foundation.This third guidance note, Introduction to Mixed Methods in Impact Evaluation, starts by explaining what a mixed methods (MM) imp
...
The arrival of COVID-19 in Afghanistan has brought heartache to millions of people who are now battling a deadly pandemic while simultaneously fighting for their survival amid poverty, disaster and war. Over my three years as Humanitarian Coordinato
...
Atlas of African Health Statistics 2022: Health situation analysis of the WHO African Region
Since 2019, we have been implementing Phase 2 of the regional Transformation Agenda, which informs and aligns with the global WHO Transformation, to ensure
...
The United Nations Development Assistance Framework (UNDAF) 2018-2022 sets out the UN partnership aiming to support Nepal as it carves out its development agenda over the next five years. At the core of this new UNDAF are the SDGs, the Government of Nepal’s Fourteenth Plan,
...
DHS Analytical Studies No. 41

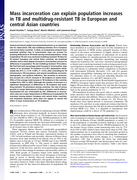
13280–13285 / PNAS / September 9, 2008 / vol. 105 / no. 36

DHS Working Papers No. 91


DHS Working Papers No. 88
education, wealth, mobility, employment, and media exposure
Trop. Med. Infect. Dis. 2018, 3, 72;
The study identified some key determinants of untimely and incomplete childhood vaccinations in the context of Bangladesh. The findings will contribute to the improvement of age-specific vaccination ...
The study identified some key determinants of untimely and incomplete childhood vaccinations in the context of Bangladesh. The findings will contribute to the improvement of age-specific vaccination ...
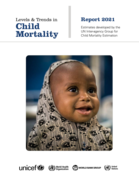
While the world was gripped by the unfolding COVID-19 pandemic in 2020, children continued to face the same crisis they have for decades: intolerably high mortality rates and vastly inequitable chances at life. In total, more than 5.0 million childr
...
Accessed June 17,2019
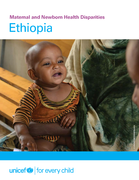
Country profile: Ethiopia
Country profile: Liberia
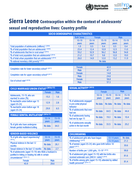
Country profile: Sierra Leone

This guideline document lays out the indicators for monitoring the 2016 Political Declaration on ending AIDS. The Global AIDS Monitoring (GAM) process has been often referenced as a benchmark for successful international accountability mechanisms.
The Lancet Planetary Health Volume 4, ISSUE 12, e566-e576, December 01, 2020. Exposure to temperature variability has been associated with increased risk of mortality and morbidity. We aimed to evaluate whether the association between short-term tem
...
WHY THIS GUIDE?
Because, in the face of crises and emergencies, it is vital to include a human rights perspective in responses. Vulnerable groups face major obstacles to accessing and benefiting fr
...
Malawi is a landlocked country with a surface area of 118,484 km2. Administratively, the country is divided into three regions, namely the Northern, Central and Southern regions. The country has 28 districts, which are further divided into tradition
...
Extraced from the full version of WDI 2016
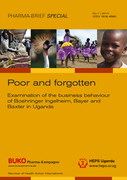
Examination of the business behaviour of Boehringer Ingelheim, Bayer and Baxter in Uganda

DHS Working Papers No. 98.
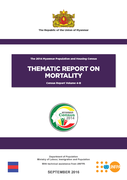
Census Report Volume 4-B
In the 2014 Census, early-age mortality was measured from the responses to two simple retrospective questions on childbearing addressed to ever-married women aged 15 and over. These questions referred to how many live c ...
In the 2014 Census, early-age mortality was measured from the responses to two simple retrospective questions on childbearing addressed to ever-married women aged 15 and over. These questions referred to how many live c ...
As part of our commitment to the fight against NCDs, Nigeria was signatory to the political declaration at the UN General Assembly High Level Meeting on NCDs in September 2011. Thus, the purpose of this document is to develop and
...
Unchecked inequality and failure to protect the rights of poorest women could undermine peace and world’s development goals, new UNFPA report warns:
- Only about half of the world’s women hold
...
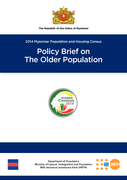
Census Report Volume 4-F (Thematic report on Population Projections for the Union of Myanmar, States/Regions, Rural and Urban Areas, 2014-2050)
Key findings
- The total population of Myanmar is estimated to be 65 million by 2050. The projec ...
Key findings
- The total population of Myanmar is estimated to be 65 million by 2050. The projec ...
Statistical Report | No. 39: 2013

DHS Working Papers No. 82
Plicy Brief
East and West Hararghe zones are located within Oromia region, one of the largest and most populated regions of Ethiopia. Like many parts of Oromia and
...