Filter
2408
Text search:
reference
manual
Featured
289
666
Language
2217
86
78
54
32
29
14
10
4
4
2
2
2
2
2
2
2
1
1
1
1
1
1
1
1
1
1
1
1
Document type
1445
400
199
195
81
52
12
10
5
4
2
2
Countries
143
64
63
63
52
51
50
44
42
42
40
39
39
36
34
33
32
30
27
25
20
18
18
16
15
14
12
11
11
10
10
9
9
8
8
7
7
7
6
6
6
6
6
6
6
6
6
6
6
6
5
5
5
4
4
4
4
4
4
4
4
4
4
3
3
3
3
3
3
3
3
3
3
2
2
2
2
2
2
2
2
2
2
2
2
2
2
1
1
1
1
1
1
1
1
1
1
1
1
1
1
1
1
1
1
1
1
1
1
1
Authors & Publishers
353
146
95
78
69
61
50
45
24
19
18
18
17
17
16
16
15
14
14
11
11
11
11
11
10
10
10
9
9
9
9
9
9
8
8
8
8
8
8
8
8
8
8
8
7
7
7
7
7
7
6
6
6
6
6
6
6
6
6
6
6
6
6
6
6
5
5
5
5
5
5
5
5
5
5
5
5
5
5
5
5
4
4
4
4
4
4
4
4
4
4
4
4
4
4
4
4
4
4
4
4
4
4
4
4
4
4
4
4
4
4
3
3
3
3
3
3
3
3
3
3
3
3
3
3
3
3
3
3
3
3
3
3
3
3
3
3
3
3
3
3
3
3
3
3
3
3
3
3
3
3
3
3
3
3
3
2
2
2
2
2
2
2
2
2
2
2
2
2
2
2
2
2
2
2
2
2
2
2
2
2
2
2
2
2
2
2
2
2
2
2
2
2
2
2
2
2
2
2
2
2
2
2
2
2
2
2
2
2
2
2
2
2
2
2
2
2
2
2
2
2
2
2
2
2
2
2
2
2
2
2
2
2
2
2
2
2
2
2
2
2
2
2
2
2
2
2
2
2
2
2
2
2
2
2
2
2
2
2
2
2
2
2
2
2
2
2
2
2
2
2
2
2
2
2
2
2
2
2
2
2
2
2
2
2
2
2
2
2
2
2
2
2
2
2
2
2
2
2
2
2
2
2
2
2
2
2
2
2
2
2
2
2
1
1
1
1
1
1
1
1
1
1
1
1
1
1
1
1
1
1
1
1
1
1
1
1
1
1
1
1
1
1
1
1
1
1
1
1
1
1
1
1
1
1
1
1
1
1
1
1
1
1
1
1
1
1
1
1
1
1
1
1
1
1
1
1
1
1
1
1
1
1
1
1
1
1
1
1
1
1
1
1
1
1
1
1
1
1
1
1
1
1
1
1
1
1
1
1
1
1
1
1
1
1
1
1
1
1
1
1
1
1
1
1
1
1
1
1
1
1
1
1
1
1
1
1
1
1
1
1
1
1
1
1
1
1
1
1
1
1
1
1
1
1
1
1
1
1
1
1
1
1
1
1
1
1
1
1
1
1
1
1
1
1
1
1
1
1
1
1
1
1
1
1
1
1
1
1
1
1
1
1
1
1
1
1
1
1
1
1
1
1
1
1
1
1
1
1
1
1
1
1
1
1
1
1
1
1
1
1
1
1
1
1
1
1
1
1
1
1
1
1
1
1
1
1
1
1
1
1
1
1
1
1
1
1
1
1
1
1
1
1
1
1
1
1
1
1
1
1
1
1
1
1
1
1
1
1
1
1
1
1
1
1
1
1
1
1
1
1
1
1
1
1
1
1
1
1
1
1
1
1
1
1
1
1
1
1
1
1
1
1
1
1
1
1
1
1
1
1
1
1
1
1
1
1
1
1
1
1
1
1
1
1
1
1
1
1
1
1
1
1
1
1
1
1
1
1
1
1
1
1
1
1
1
1
1
1
1
1
1
1
1
1
1
1
1
1
1
1
1
1
1
1
1
1
1
1
1
1
1
1
1
1
1
1
1
1
1
1
1
1
1
1
1
1
1
1
1
1
1
1
1
1
1
1
1
1
1
1
1
1
1
1
1
1
1
1
1
1
1
1
1
1
1
1
1
1
1
1
1
1
1
1
1
1
1
1
1
1
1
1
1
1
1
1
1
1
1
1
1
1
1
1
1
1
1
1
1
1
1
1
1
1
1
1
1
1
1
1
1
1
1
1
1
1
1
1
1
1
1
1
1
1
1
1
1
1
1
1
1
1
1
1
1
1
1
1
1
1
1
1
1
1
1
1
1
1
1
1
1
1
1
1
1
1
1
1
1
1
1
1
1
1
1
1
1
1
1
1
1
1
1
1
1
1
1
1
1
1
1
1
1
1
1
1
1
1
1
1
1
1
1
1
1
1
1
1
1
1
1
1
1
1
1
1
1
1
1
1
1
1
1
1
1
1
1
1
1
1
1
1
1
1
1
1
1
1
1
1
1
1
1
1
1
1
1
1
1
1
1
1
1
1
1
1
1
1
1
1
1
1
1
1
1
1
1
1
1
1
1
1
1
1
1
1
1
1
1
1
1
1
1
1
1
1
1
1
1
1
1
1
1
1
1
1
1
1
1
1
1
1
1
1
1
1
1
1
1
1
1
1
1
1
1
1
1
1
1
1
1
1
1
1
1
1
1
1
1
1
1
1
1
1
1
1
1
1
1
1
1
1
1
1
1
1
1
1
1
1
1
1
1
1
1
1
1
1
1
1
1
1
1
1
1
1
1
1
1
1
1
1
1
1
1
1
1
1
1
1
1
1
1
1
1
1
1
1
1
1
1
1
1
1
1
1
1
1
1
1
1
1
1
1
1
1
1
1
1
1
1
1
1
1
1
1
1
1
1
1
1
1
1
1
1
1
1
1
1
1
1
1
1
1
1
1
1
1
1
1
1
1
1
1
1
1
1
1
1
1
1
1
1
1
1
1
1
1
1
1
1
1
1
1
1
1
1
1
1
1
1
1
1
1
1
1
1
1
1
1
1
1
1
1
1
1
1
1
1
1
1
1
1
1
1
1
1
1
1
1
1
1
1
1
1
1
1
1
1
1
1
1
1
1
1
1
1
1
1
1
1
1
1
1
1
1
1
1
1
1
1
1
1
1
1
1
1
1
1
1
1
1
1
1
1
1
1
1
1
1
1
1
1
1
1
1
1
1
1
1
1
1
1
1
1
1
1
1
1
1
1
1
1
1
1
1
1
1
1
1
1
1
1
1
1
1
1
1
1
1
1
1
1
1
1
1
1
1
1
1
1
1
1
1
1
1
1
1
1
1
1
1
1
1
1
1
1
1
1
1
1
1
1
1
1
1
1
1
1
1
1
1
1
1
1
1
1
1
1
1
1
1
1
1
1
1
1
1
1
1
1
1
1
1
1
1
1
1
1
1
1
1
1
1
1
1
1
1
1
1
1
1
1
1
1
1
1
1
1
1
1
1
1
1
1
1
1
1
1
1
1
1
1
1
1
1
1
1
1
1
1
1
1
1
1
1
1
1
1
1
1
1
1
1
1
1
1
1
1
1
1
1
1
1
1
1
1
1
1
1
1
1
1
1
1
1
1
1
1
1
1
1
1
1
1
1
1
1
1
1
1
1
1
1
1
1
1
1
1
1
1
1
1
1
1
1
1
1
1
1
1
1
1
1
1
1
1
1
1
1
1
1
1
1
1
1
1
1
1
1
1
1
1
1
1
1
1
1
1
1
1
1
1
1
1
1
1
1
1
1
1
1
1
1
1
1
1
1
1
1
1
1
1
1
1
1
1
1
1
1
1
1
1
1
1
1
1
1
1
1
1
1
1
1
1
1
1
1
1
1
1
1
1
1
1
1
1
1
1
1
1
1
1
1
1
1
1
1
1
1
1
1
1
1
1
1
1
1
1
1
1
1
1
1
1
1
1
1
1
1
1
1
1
1
1
1
1
1
1
1
1
1
1
1
1
1
1
1
1
1
1
1
1
1
1
1
1
1
1
1
1
1
1
1
1
1
1
1
1
1
1
1
1
1
1
1
1
1
1
1
1
1
1
1
1
1
1
1
1
1
1
1
1
1
1
1
1
1
1
1
1
1
1
1
1
1
1
1
1
1
1
1
1
1
1
1
1
1
1
1
1
1
1
1
1
1
1
1
1
1
1
1
1
1
1
1
1
1
1
1
1
1
1
1
1
1
1
1
1
1
1
1
1
1
1
1
1
1
1
1
1
1
1
1
1
1
1
1
1
1
1
1
1
1
1
1
1
1
1
1
1
1
1
1
1
1
1
1
1
1
1
1
1
1
1
1
1
1
1
1
1
1
1
1
1
1
1
1
1
1
1
1
1
1
1
1
1
1
1
1
1
1
1
1
1
1
1
1
1
1
1
1
1
1
1
1
1
1
1
1
1
1
1
1
1
1
1
1
1
1
1
1
1
1
1
1
1
1
1
1
1
1
1
1
1
1
1
1
1
1
1
1
1
1
1
1
1
1
1
1
1
1
1
1
1
1
1
1
1
1
1
1
1
1
1
1
1
1
1
1
1
1
1
1
1
1
1
1
1
1
1
1
1
1
1
1
1
1
1
1
1
1
1
1
1
1
1
1
1
1
1
1
1
1
1
1
1
1
1
1
1
1
1
1
1
1
1
1
1
1
1
1
1
1
1
1
1
1
1
1
1
1
1
1
1
1
1
1
1
1
1
1
1
1
1
1
1
1
1
1
1
1
1
1
1
1
1
1
1
1
1
1
1
1
1
1
1
1
1
1
1
1
1
1
1
1
1
1
1
1
1
1
1
1
1
1
1
1
1
1
1
1
1
1
1
1
1
1
1
1
1
1
1
Publication Years
1
492
1523
361
31
Category
890
217
192
155
139
136
54
3
3
Toolboxes
160
151
137
117
110
101
94
92
85
51
50
47
45
40
29
24
19
15
15
11
5
5
5
2
A guidance document in simple language for health personnel, setting out their rights and responsibilities in conflict and other situations of violence. It explains how responsibilities and rights for health personnel can be derived from international humanitarian law, human rights law and medical e
...
thics.The document gives practical guidance on:
- The protection of health personnel, the sick and the wounded; - Standards of practice; - The health needs of particularly vulnerable people; - Health records and transmission of medical records; - "Imported" health care (including military health care);
- Data gathering and health personnel as witnesses to violations of international law; - Working with the media
more

“Our children have the right to an education too”: Strategies Employed by Orange Farm Caregivers of Children with Disabilities in Pursuit of the Right to a Basic Education
Elphick, J., De SasKropiwnicki, Z. &Elphick, R.
Disability, CBR & Inclusive Development Journal (DCIDJ)
(2015)
CC
This paper aims to understand the agency that caregivers who participated in a CBR empowerment component programme exercised, in order to promote the rights of their children with disabilities to a basic education.
While the ratification of the Convention and its Optional Protocol has proceeded rapidly, knowledge on how to implement and monitor them has not kept pace. Conscious of this challenge, my Office has developed this Training Guide on the Convention and its Optional Protocol. It is complemented by eigh
...
t training modules, designed to inform and empower those who are involved in ratifying, implementing and monitoring the two instruments. While the Training Guide is mainly targeted at facilitators of training courses on the Convention and its Optional Protocol, it acknowledges that each and every one of us has a role to play. I recommend wide dissemination of the training package, and its use by all those who want to embark upon the essential journey towards greater awareness and effective implementation of the rights of persons with disabilities and, ultimately, the building of an inclusive society for all.
more
Census Report Volume 4-A
This thematic report presents findings on fertility and nuptiality in Myanmar. The analysis hows that the total fertility rate is 2.5 children per woman at the Union level, 1.9 children per woman for urban areas, and 2.8 children per woman for rural areas. Total fertili ... ty for States and Regions varies from a high of 5.0 children per woman for Chin State to a low of 1.8 children per woman for Yangon Region. Total fertility appears to have declined at a rate of at least one child per woman per decade between 1970 and 2000. This relatively rapid decline apparently ceased sometime during the 1990s or 2000s. Estimates from the 2001 and 2007 surveys suggest that the level of fertility may have fluctuated between 2000 and 2014, but with no overall trend up or down. The marital status data shows an exceptionally high proportion of women remaining never married at age 50. more
This thematic report presents findings on fertility and nuptiality in Myanmar. The analysis hows that the total fertility rate is 2.5 children per woman at the Union level, 1.9 children per woman for urban areas, and 2.8 children per woman for rural areas. Total fertili ... ty for States and Regions varies from a high of 5.0 children per woman for Chin State to a low of 1.8 children per woman for Yangon Region. Total fertility appears to have declined at a rate of at least one child per woman per decade between 1970 and 2000. This relatively rapid decline apparently ceased sometime during the 1990s or 2000s. Estimates from the 2001 and 2007 surveys suggest that the level of fertility may have fluctuated between 2000 and 2014, but with no overall trend up or down. The marital status data shows an exceptionally high proportion of women remaining never married at age 50. more
Census Report Volume 4-F (Thematic report on Population Projections for the Union of Myanmar, States/Regions, Rural and Urban Areas, 2014-2050)
Key findings
- The total population of Myanmar is estimated to be 65 million by 2050. The projection is based on steadily declining population grow ... th rate over the projection period: from 0.9 per cent in 2015 to 0.3 per cent in 2050.
- The proportion of the urban population rises from 29.3 per cent in 2015 to 34.7 in 2050. The rural and urban crude birth rates both decline between 2015 and 2050, but the difference between them narrows to almost zero by the end of the period.
- The population of Yangon grows more rapidly than any other area, by 39 per cent between 2015 and 2031. Other rapidly growing areas include Kayah (37 per cent), Kachin (32 per cent), Nay Pyi Taw (27 per cent), and Shan (26 per cent). Ayeyawady, Magway and Mon lose population, mostly due to migration. more
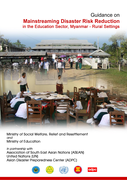
The scope of the Guidance is primarily the education in rural settings in Myanmar, but it covers some of the issues which have pan Myanmar implication and relevance. Considering the importance, complexity and vastness of the subject, similar type of initiatives on urban school and education system a
...
nd other issues needs to be taken up in future.
The Guidance has four sections namely Introduction to this Guidance, Rationale for Mainstreaming DRR in the Education Sector, How to Mainstream Disaster Risk Reduction in Reconstruction Process of Education Sector in Myanmar and Creating an Enabling Environment for Safer Education. The Guidance also includes good practices of various agencies involved in Cyclone Nargis education sector recovery as example.
No publication year indicated. more
The Look Back Study (LBS) focuses on the water and sanitation and hygiene (WASH) component of the project but some additional information was collected along side the WASH data. This data has been compared to the baseline survey data that was reported at start of the project (see tables in annex D t
...
o this report).
more
Full eHandbook under: http://www.msh.org/resources/health-systems-in-action-an-ehandbook-for-leaders-and-managers
Effective supply management has the potential to make a powerful contribution to the reliable availability of essential medicines, which are a crucial part of the delivery of highqualit
...
y health care services. Because medicines are costly and poor management so often results in waste, good supply management is also crucial to the cost-effectiveness of providing medicines.
more
Stop TB`s GDF provides a wide range of diagnostic equipment and laboratory supplies in its Diagnostics Catalog
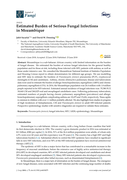
With this study, we estimated the burden of serious fungal infections for the general healthy population and for those at risk, including those infected with HIV, patients with asthma, as well as those under intensive care. We also highlight from studies in progress of high incidences of histoplasm
...
osis, CM and Pneumocystis jirovecii in adult HIV-infected patients.
more
CBM strategy overview paper on preventing physical impairment in childhood.

Knowledge of Primary School Teachers in Identifying Children with Learning Disabilities
Shari Moothedath, Mysore Narasimha Vranda
Disability, CBR & Inclusive Development Journal (DCIDJ)
(2015)
CC
This study explores the knowledge of primary school teachers in
identifying children with learning disabilities.
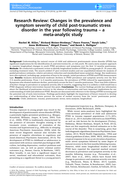
Background: Understanding the natural course of child and adolescent posttraumatic stress disorder (PTSD) has significant implications for the identification of, and intervention for, at-risk youth. We used a meta-analytic approach to examine longitudinal changes in youth PTSD prevalence and symptom
...
s over the first 12 months posttrauma.
Journal of Child Psychology and Psychiatry57:8 (2016), pp 884–898
more
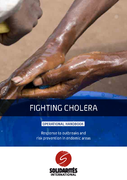
Cholera is a diarrhoeal disease that is usually contracted when drinking water contaminated with Vibrio cholerae bacteria. The fight against this disease requires a multidisciplinary approach that combines a water, hygiene and sanitation (WaSH) response with a monitoring system, improved water suppl
...
y and quality, sanitation and hygiene, and a health response with the treatment of the disease itself.
more
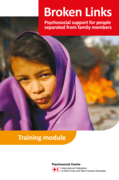
Broken Links: Psychosocial support for people separated from family members (Training
module) and the corresponding Broken Links field guide are designed to support staff and
volunteers in a wide range of settings where they may be in contact with families who have
been separated from their loved
...
ones. The field guide and the training module outline the
causes and consequences of being separated from family members, as well as the types of
contact staff and volunteers might have with families affected by separation.
more
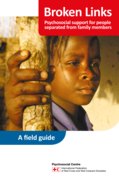
Broken links Psychosocial support for people separated from family members: a field guide
recommended
The 40-page field guide outlines possible causes of separation, discusses the psychosocial impacts of being separated, such as how we experience loss, and provides guidelines on how to support those who have been separated from family members – including delivering difficult news to loved ones, ba
...
sic helping skills, interviews, on-going support and referrals, and reunification. There is also a chapter on self-care for staff and volunteers. The materials provided here will need to be adapted to suit local contexts. The aim of this field guide is to build both confidence and skills in responding to disaster and crisis situations, and to raise awareness of the broader goals of the Movement’s work in supporting families separated from their loved ones
more
Creating a Healing Environment - Volume II: Technical Papers
John Frederick
International Labour Organization IPEC & Trafficking in Children-South Asia (TICSA)
(2002)
C1
Psycho-Social Rehabilitation and Occupational Integration of Child Survivors of Trafficking and Other Worst Forms of Child Labour |
Managing Sexual Violence against Aid Workers aims to support aid agencies in preventing, being prepared for and responding to incidents of sexual violence against their staff. It is intended as a good practice guide to help strengthen existing processes and support organisations as they set up their
...
own protocols.
This guide is aimed at anyone with a responsibility for staff care, safety and security, as well as anyone involved in processes aimed at preventing or responding to incidents of sexual violence against staff, such as security focal points, HR staff, project and programmes staff, and first responders to incidents of sexual violence within an aid organisation.
more