Filter
2065
Text search:
key
child
nutrition
indicators
Featured
164
767
Language
Document type
1432
277
129
93
78
20
18
10
4
2
2
Countries
124
114
92
80
71
71
66
63
61
59
54
51
49
46
45
42
40
33
29
28
26
25
24
22
19
18
18
17
16
15
15
14
14
11
11
11
11
10
10
9
9
9
8
8
7
7
7
6
5
5
5
5
5
4
4
4
4
4
3
3
3
3
3
3
3
3
2
2
2
2
2
2
2
2
2
2
2
2
2
1
1
1
1
1
1
1
1
1
1
1
1
1
1
1
1
1
1
1
1
1
1
1
1
1
1
1
1
1
Authors & Publishers
Publication Years
Category
1197
164
105
103
85
33
5
2
Toolboxes
94
85
84
80
76
67
63
56
53
25
24
22
20
16
15
14
8
6
6
4
2
2
2
1
Further Analysis of the 2000, 2005, and 2011 Demographic and Health Surveys. DHS Further Analysis Reports No. 83
The agenda focuses on six critical changes necessary for more children suffering from SAM to access effective treatment. Building on lessons from the last decade, and the experiences of other successful health initiatives, the agenda addresses issues ranging from the creation of a more enabling envi
...
2015-16 Demographic and Health Survey and Malaria Indicator Survey
This document sets out Rwanda's Maternal, Neonatal Child Health (MNCH) national strategy (July 2013- June 2018). The MNCH strategy provides a framework for addressing maternal, neonatal and child he
...
Tracking progress on food and agriculture-related SDG indicators 2021 -
Food and Agriculture Organization of the United Nations
Further analysis of the 2011 Nepal Demographic and Health Survey
This checklist will help child psychosocial support and Child Friendly Space supervisors adhere to quality standards during program implementation. This checklist was developed by consultant Nicole
...
For applying the new operational guidance on CB-MHPSS in the field, UNICEF country offices and partners will need ready access to tools and resources that can be used to implement the programs. By bringing together resources from different contexts, the compendium makes options available to country
...
Thirty years ago, the United Nations General Assembly adopted the Convention on the Rights of the Child at a moment of rapid global change marked by the end of apartheid, the fall of the Berlin Wall and the birth of the World Wide Web. These develop
...


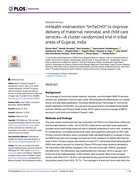
Health Policy Plan (2017) 32 (5): 603-612; 10 pp. 318 kB
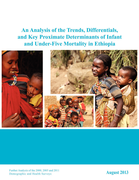
Further Analysis of the 2000, 2005, and 2011 Demographic and Health Surveys. DHS Further Analysis Reports No. 79
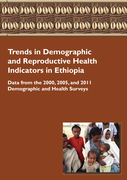
Data from the 2000, 2005, and 2011 Demographic and Health Surveys. DHS Trend Reports No. 7
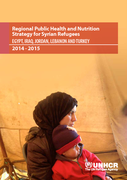
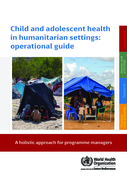
Humanitarian crises exacerbate nutritional risks and often lead to an increase in acute malnutrition. Emergencies include both manmade (conflict) and natural disasters (floods, drought, cyclones, typhoons, earthquakes, volcanic eruptions, etc.). Complex emergencies are combinations of both manmade a
...
DHS Further Analysis Reports No. 97
2016 Update
Key population
Levels and Inequities
DHS Further Analysis Reports No. 110
This study shows large variations in maternal health indicators across high-priority counties in Kenya. Nairobi exceeds the national average on all maternal health ...
DHS Further Analysis Reports No. 110
This study shows large variations in maternal health indicators across high-priority counties in Kenya. Nairobi exceeds the national average on all maternal health ...
Guidelines
Key Populations
Accessed: 08.11.2019
The Minimum Standards and Indicators for Community Engagement were developed through an inter‑agency consultation process that engaged a large number of experts from around the world. UNICEF wishes to acknowledge the contribution of all those that
...
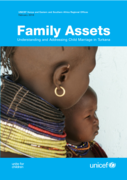
Child marriage is a widespread practice across Turkana, a nomadic pastoralist region in Kenya. This report explores the issue through the voices of those girls affected by it.
This report is the annual global monitoring report documenting progress towards Sustainable Development Goal (SDG) 2 targets 2.1 and 2.2. This year’s report explores the links between urbanization and changing food systems and how these changes are impacting the availability, affordability and des
...
The Core Set of Indicators and respective Indicator Data Sheets aim to pave the way towards a common understanding, greater consistency and comparability across countries and alignment of results chains of German Development Cooperation in the field
...

In 2017, the World Bank and partners created the Global Investment Framework for Nutrition as a roadmap towards achieving the World Health Assembly (WHA) nutrition targets by 2025. The framework est
...
Based on further analysis of the 2004 Kenya Service Provision Assessment Survey
Further Analysis of the 2000, 2005, 2010, and 2014 Cambodia Demographic and Health Surveys | DHS Further Analysis Reports No. 106
The purpose of this publication is to facilitate the implementation of existing WHO guidelines on nutrition-specific and nutrition-sensitive actions required for improving health and well-being of a
...
UNICEF Strategic Plan 2018-2021. Draft Theory of Change Paper
The Border Consortium (TBC) developed a comprehensive Training of Trainers Nutrition Curriculum which includes 12 Modules (6 Basic and 6 Advanced topics). The Manual provides trainers with standardized methods and content to deliver
...
Grounded in the foundations of child centered community development, the success of this strategy will be measured by how individual countries contribute to their child protection systems and partne
...
Investing in Child Protection
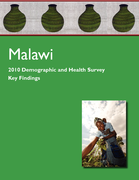
Building Inclusive, Productive and Resilient Communities in Malawi
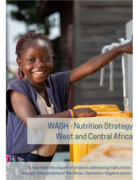
This document was prepared by UNICEF Regional Office for West and Central Africa, under the leadership of Christophe Valingot and the review of Joachim Peeters (WASH Specialist) and Arnaud Laillou (Nutrition Specialist), on behalf of the WASH Region
...
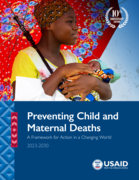
Improving the survival chances and quality of life of women, newborns, and children remains an urgent global challenge. Since 2012, substantial progress has been made in reducing maternal and under-5 deaths, and a only handful of countries are on target to meet the SDG targets in 2030. Yet, 5 millio
...
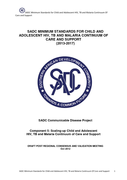
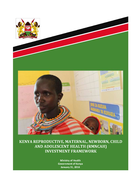
SADC Communicable Disease Project
Component 5: Scaling-up Child and Adolescent HIV, TB and Malaria Continuum of Care and Support
DRAFT POST REGIONAL CONSENSUS AND VALIDATION MEETING Oct 2012

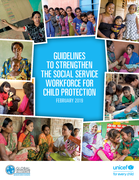
These guidelines are informed by evidence of ‘what works’ and lessons learned in the field. They are designed to accelerate UNICEF regional and country offices’ programming on social service workforce strengthening, and support work to better plan, develop and support the social services workf
...
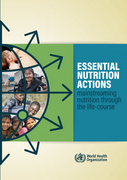
This publication’s primary purpose is to provide a compilation of actions to address malnutrition in all its forms, in a concise and user-friendly format to help in decision-making processes for integration of nutrition interventions in national h
...
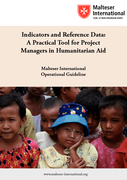
Operational Guideline
An Advocate’s Guide: Strategic Indicators for Universal Access to Sexual and Reproductive Health and Rights
recommended
This guide was prepared to enable advocates to use data
when advocating for universal access to SRHR at the national,
regional and global levels. It is a direct outcome of the Strategic
SRHR Indicators workshop held in Kuala Lumpur, Malaysia on
...
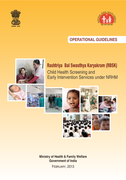
Rashtriya Bal Swasthya Karykram (RBSK). Operational Guidelines
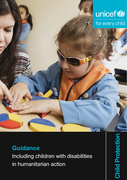
Guidance | Preparedness - Response and early recovery - Recovery and reconstruction

Adolescence is a critical stage in life for physical, cognitive and emotional development, shaping future health and well-being. Comprehensive measurement of adolescent health is essential to prioritize health issues, guide interventions and track progress. However, global, regional and national ado
...
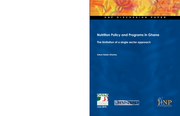
The limitation of a single sector approach. HNP Discussion Paper
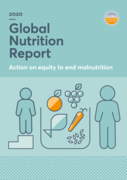
As the COVID-19 pandemic continues to threaten health and food systems around the world, the 2020 Global Nutrition Report calls on governments, businesses and civil society to step up efforts to address malnutrition in all its forms.
The Federal Ministry of Health (FMOH) has been coordinating sector wide reforms that aim to improve equity and quality of maternal and child health services. As part of these efforts, the ministry is also exerting concerted effor
...
The integrated Global Action Plan for Pneumonia and Diarrhoea (GAPPD)

DHS Working Papers No. 98.
Over the period 2015 to 2019, scaling up a package of selected nutrition-specific and nutrition sensitive interventions to cover 90 per cent of Sudan would:
- Reduce the under-five mortality r ...
- Reduce the under-five mortality r ...
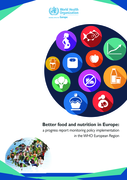
This report on progress achieved in the WHO European Region and Member States in implementing the European food and nutrition action plan 2015–2020 presents selected epidemiological data on the nutritional status of populations throughout the Regi
...
The Essential WASH Actions toolkit expands the connection between WASH and nutrition. This resource offers a comprehensive set of essential WASH actions, references training materials for health workers, n
...

Nutrition Surveys