Filter
5002
Filtered Results: 5002
Text search:
demograhic
data
Featured
Recommendations
306
New Publications
1609
Language
Document type
No document type
3186
Studies & Reports
988
Guidelines
308
Manuals
161
Strategic & Response Plan
155
Fact sheets
85
Situation Updates
44
Training Material
36
Infographics
21
Resource Platforms
14
Dashboards/Maps
2
Brochures
1
Online Courses
1
Countries / Regions
Global
209
Ethiopia
198
Kenya
195
Congo, Democratic Republic of
143
Nepal
138
Uganda
137
Nigeria
135
Rwanda
127
Sierra Leone
122
India
118
Liberia
116
Malawi
113
Zambia
112
Myanmar / Burma
110
South Africa
95
Tanzania
90
Bangladesh
90
Africa
88
Ghana
81
Western and Central Europe
68
Senegal
65
Indonesia
62
Lesotho
61
Syria
59
Namibia
58
Latin America and the Carribbean
57
Zimbabwe
54
Cambodia
52
Philippines
48
South Sudan
48
Ukraine
47
Asia
42
Mozambique
41
South–East Asia Region
37
Burkina Faso
35
Guinea
31
Haiti
30
Pakistan
27
Afghanistan
27
West and Central Africa
27
Cameroon
25
Botswana
24
East and Southern Africa
24
Brazil
23
Eastern Europe
23
Central African Republic
22
Eswatini/ Swaziland
20
Germany
19
Yemen
19
Mali
18
Benin
18
Middle East and North Africa
18
Somalia
17
Venezuela
16
Russia
16
Sudan
15
Jordan
14
Colombia
14
Lebanon
12
Eastern Europe and Central Asia
12
Côte d’Ivoire / Ivory Coast
11
Thailand
11
Madagascar
11
Western Pacific Region
11
China
10
Sri Lanka
10
Albania
10
Papua New Guinea
9
Peru
9
Tajikistan
8
Egypt
7
Burundi
7
Paraguay
7
Southern Africa
7
Laos
7
Moldova
7
Vietnam
7
Niger
6
Iraq
6
Palestine
6
USA
5
Angola
5
Chile
5
North America
5
Turkey
4
Chad
4
Argentina
4
North Macedonia
4
Ecuador
4
Greece
4
Libya
4
Mexico
4
Timor Leste/ East Timor
4
Iran
4
Guinea-Bissau
3
Togo
3
Gambia
3
Singapore
3
Bolivia
3
Bhutan
3
Poland
3
Kyrgyzstan
3
Malaysia
2
Serbia
2
North Korea
2
Armenia
2
Romania
2
Gabon
2
Jamaica
2
France
2
United Kingdom
2
Belarus
2
Morocco
1
Saudi Arabia
1
Vanuatu
1
Dominican Republic
1
Switzerland
1
Hungary
1
Croatia
1
Honduras
1
Guatemala
1
Other region
1
Solomon Islands
1
Italy
1
Djibouti
1
Mongolia
1
Congo-Brazzaville
1
Canada
1
Qatar
1
Bulgaria
1
Estonia
1
Lithuania
1
Uzbekistan
1
Kazakhstan
1
Georgia
1
Turkmenistan
1
Mauritius
1
Tunisia
1
Portugal
1
Spain
1
Azerbaijan
1
Latvia
1
Authors & Publishers
Publication Years
Category
Countries
2402
Public Health
252
Clinical Guidelines
242
Women & Child Health
241
Key Resources
194
Capacity Building
55
Pharmacy & Technologies
25
Annual Report MEDBOX
1
Toolboxes
HIV
383
Mental Health
303
COVID-19
297
Planetary Health
184
TB
181
Disability
178
Ebola
151
Conflict
135
Rapid Response
131
Global Health Education
109
NTDs
109
Refugee
90
AMR
80
Caregiver
78
NCDs
66
Health Financing Toolbox
59
Natural Hazards
50
Pharmacy
39
Polio
30
Cholera
28
Specific Hazards
15
Social Ethics
12
Zika
11
South Sudan
2
Health Financing
1
Further Analysis of the 2014 Cambodia Demographic and Health Survey | DHS Further Analysis Reports No. 105

Further Analysis of the 2010 and 2014 Cambodia Demographic and Health Surveys | DHS Further Analysis Reports No. 104
Further Analysis of the 2011 Ethiopia Demographic and Health
Survey. DHS Further Analysis Reports No. 82
Further Analysis of the 2000, 2005, and 2011 Demographic and Health Surveys. DHS Further Analysis Reports No. 81
Further Analysis of the 2000, 2005, and 2011 Demographic and Health Surveys. DHS Further Analysis Reports No. 79
Further Analysis of the 2000, 2005, and 2011 Demographic Health Surveys. DHS Further Analysis Reports No. 72
Further analysis of the 2011 Nepal Demographic and Health Survey
Further analysis of the Nepal Demographic and Health Surveys, 2001-2011
Further analysis of the 2011 Nepal Demographic and Health Survey
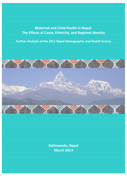
Further analysis of the 2011 Nepal Demographic and Health Survey
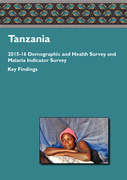
2015-16 Demographic and Health Survey and Malaria Indicator Survey
DEMOGRAPHIC RESEARCH, VOLUME 36, ARTICLE 37, PAGES 1081-1108; PUBLISHED 5 APRIL 2017; http://www.demographic-research.org/Volumes/Vol36/37/; DOI: 10.4054/DemRes.2017.36.37
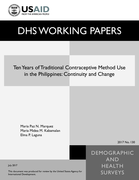
Demographic Health Survey Working Paper 2017 No. 130
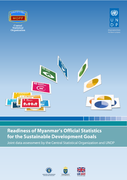
Joint data assessment by the Central Statistical Organization and UNDP
The report shows that the National Statistical System of Myanmar has some work ahead of it in terms of preparing for the monitoring of the SDG indicators. Only 44 of the SDG...
The report shows that the National Statistical System of Myanmar has some work ahead of it in terms of preparing for the monitoring of the SDG indicators. Only 44 of the SDG...
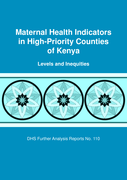
Levels and Inequities
DHS Further Analysis Reports No. 110
This study shows large variations in maternal health indicators across high-priority counties in Kenya. Nairobi exceeds the national average on all maternal health indicators in this study, while other highpriority counties consist...
DHS Further Analysis Reports No. 110
This study shows large variations in maternal health indicators across high-priority counties in Kenya. Nairobi exceeds the national average on all maternal health indicators in this study, while other highpriority counties consist...
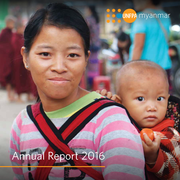
Census data shows that Myanmar can harness a double dividend – both youth and gender. This year’s annual report provides many facets of the journey to gender equality. It tells a story of widening horizons for women and girls who are capable in ...

DEMOGRAPHIC AND HEALTH SURVEYS DHS WORKING PAPERS 2015 No. 117
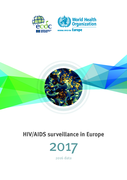
2016 data
The report was coordinated by Anastasia Pharris and Annemarie Stengaard.
Report review and production support were provided by Andrew J. Amato-Gauci, Mike Catchpole, Denis Coulombier, Masoud Dara, Nedret Emiroglu, Rachel Katterl, Sha...
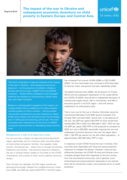
Data from 22 countries across the region featured in the study shows children are bearing the heaviest burden of the economic crisis caused by the war in Ukraine. While children make up 25 per cent of the population, they account for nearly 40 per c...
Annual Household Survey 2015/16 is the forth survey of its kind. These annual surveys are conducted to provide estimations of some major socio-economic indicators on annual basis which would not be possible with other periodic surveys like Nepal Labour Force Surveys (NLSS) and Nepal Living Standard ...