Filter
2064
Text search:
summary
statistics
Featured
93
716
Language
Document type
1425
360
102
60
46
20
19
15
9
4
1
1
Countries
100
68
66
66
62
61
55
53
51
51
50
50
49
43
40
40
39
34
33
28
28
27
25
24
23
21
21
20
20
19
16
16
13
12
11
11
11
11
10
10
10
10
8
8
7
7
7
7
7
7
7
6
6
6
6
6
5
5
5
5
5
5
4
4
4
4
4
4
4
4
3
3
3
3
3
3
3
3
2
2
2
2
2
2
2
2
2
2
2
2
2
2
2
2
2
1
1
1
1
1
1
1
1
1
1
1
1
1
1
1
1
1
1
1
1
1
1
1
1
1
Authors & Publishers
Publication Years
Category
1097
105
98
74
72
35
9
1
Toolboxes
137
124
115
89
73
73
45
40
38
36
36
35
31
30
25
24
23
17
8
6
5
4
3
2
1
1
The LDHS provides an opportunity to inform policy and provide data for planning, implementation, and monitoring and evaluation of national health programs. It is designed to provide up-to-date information on health indicators including fertility levels, sexual activity, fertility preferences, awaren
...
A comprehensive summary of mental health research, providing a unique handbook of key facts and figures, covering all key areas of mental health
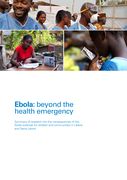
Summary of research into the consequences of the Ebola outbreak for children and communities in Liberia and Sierra Leone
This study describes the range of impacts that Ebola has had on children and families in Liberia and Sierra Leone, looking beyo
...
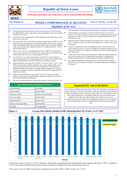
July 2022 Core epidemiology slides
recommended
Executive summary — In Danger: UNAIDS Global AIDS Update 2022 Slide Sets
Young people living in the Central African Republic, Chad, Nigeria, Guinea, and Guinea-Bissau are the most at risk of the impacts of climate change, threatening their health, education, and protection, and exposing them to deadly diseases. The report is the first comprehensive analysis of climate ri
...
Regional Operational Plan 2016 FY17 Strategic Direction Summary
2 May 2016
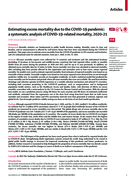
Mortality statistics are fundamental to public health decision making. Mortality varies by time and location, and its measurement is affected by well known biases that have been exacerbated during the COVID-19 pandemic.
...
A summary of the national drug situation
A summary of the national drug situation

A Summary
Accessed: 23.11.2019
The Statistical Yearbook for Latin America and the Caribbean of ECLAC presents a set of basic statistics on the economic, sociodemographic and environmental situation of the region during a specific time period.

Conducted November 2011 to February 2012: Summary Report
This summary report has five sections. Following the introduction (Section 1), Section 2 sets out ...
This summary report has five sections. Following the introduction (Section 1), Section 2 sets out ...
Evaluation of Norwegian support to promote the rights of persons with disabilities, Uganda country study – Summary
This report is from the National study on living conditions among people
with disabilities carried out in Nepal in 2014-2015. The study was carried
out as a household survey with two-stage stratified sampling, including a screening/listing procedure using the Washington Group on Disability
...
Global Biodiversity Outlook (GBO) is the flagship publication of the Convention on Biological Diversity (CBD). It is a periodic report that summarizes the latest data on the status and trends of biodiversity and draws conclusions relevant to the further implementation of the Convention.
GBO-5 pro
...
This report of the EFSA and ECDC presents the results of zoonoses monitoring activities carried out in 2020 in 27 EU Member States (MS) and nine non-MS. Key statistics on zoonoses and zoonotic agents in humans, food, animals and feed are provided an
...
As the culminating volume in the DCP3 series, volume 9 will provide an overview of DCP3 findings and methods, a summary of messages and substantive lessons to be taken from DCP3, and a further discussion of cross-cutting and synthesizing topics acro
...
Census Report Volume 4-K
The results of the 2014 Census collected only relates to four of the six types of disability domains recommended by the Washington Group on Disability Statistics, namely: seeing, hearing, walking, and remembering or co ...
The results of the 2014 Census collected only relates to four of the six types of disability domains recommended by the Washington Group on Disability Statistics, namely: seeing, hearing, walking, and remembering or co ...
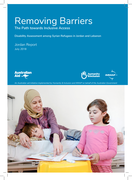
22.9% of surveyed Syrian refugees aged 2 years and above had disabilities (1,374 persons out of 6,003 persons): 13.8% in Azraq camp, 23.5% in Irbid and 30.5% in Zaatari camp. Understanding disability as the level of difficulties a person is facing when performing basic activities that could put him/
...
Antimicrobial resistance is a global threat as it is present in all parts of the world and it means that there is a shortage of effective antibiotics to treat simple infections and diseases, also statistics reveal that because of antimicrobial resis
...
Available in Arabic, Chinese, English, French, Russian and Spanish. You can download a summary of the main report and background documents!
The report demonstrates that the current system—at both national and international levels— was not adeq
...
The WHO Pharmaceuticals Newsletter provides you with the latest information on the safety of medicinal products and regulatory actions taken by authorities around the world.
In addition, this edition includes summary and recommendations from the vi
...
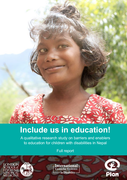
A 2013 Plan study across 30 countries found that children with disabilities were on average 10 times less likely to go to school than children without disabilities. This report presents the findings of a follow-up second phase to the research with a qualitative study on barriers and enablers to educ
...
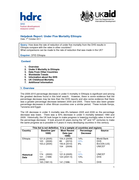
The guidelines are presented in the form of the following chapters:
Chapter 1: Floods status and context
Chapter 2: Institutional framework and financial arrangements
Chapter 3: Flood prevention, preparedness and mitigation
Chapter 4: Flood forecasting and warning in India
C ...
Chapter 1: Floods status and context
Chapter 2: Institutional framework and financial arrangements
Chapter 3: Flood prevention, preparedness and mitigation
Chapter 4: Flood forecasting and warning in India
C ...
More than 700 000 people lose their life to suicide every year. The world is not on track to reach the 2030 suicide reduction targets. WHO advocates for countries to take action to prevent suicide, ideally through a comprehensive national suicide prevention strategy. Governments and communities can
...
The report shows that older people are not getting the healthcare treatments they desperately need. The COVID-19 response has disrupted services for non-communicable diseases such as cancer and diabetes, communicable diseases such as malaria, and much-needed services for mental health. Combined with
...

Front. Med., 27 November 2020 | https://doi.org/10.3389/fmed.2020.594728. The Checklist included eight actions for implementing rural pathways in LMICs: establishing community needs; policies and partners; exploring existing workers and scope; selecting health workers; education and training; workin
...
Background: Cervical cancer accounts for 23% of cancer incidence and 22% of cancer mortality among women in Burkina Faso. These proportions are more than 2 and 5 times higher than those of developed countries, respectively. Before 2010, cervical cancer prevention (CECAP) services in Burkina Faso wer
...
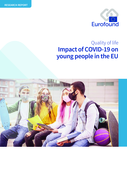
Following a long recovery from the economic crisis (2007–2013), young people in the EU proved to be more vulnerable to the effects of the restrictions put in place to slow the spread of the COVID-19 pandemic. Young people were more likely than older groups to experience job loss, financial insecur
...
The following technical report outlines the rationale, process and results of a joint research study, coordinated by the World Health Organization (WHO) and the Pan-American Health Organization (PAHO), co-chaired by the Ministry of Health and Social Protection and the Ministry of Environment and Sus
...

The WHO Global Antimicrobial Resistance and Use Surveillance System (GLASS) was launched in 2015 to foster AMR surveillance and inform strategies to contain AMR. The system started with surveillance of AMR in bacteria causing common human infections and has expanded its scope to include surveillance
...
The United States Agency for International Development (USAID) Bureau for Democracy, Conflict, and Humanitarian Assistance Office of U.S. Foreign Disaster Assistance (DCHA/OFDA) requested Food and Nutrition Technical Assistance II Project (FANTA-2) assistance to review Community-Based Management of
...
Little is known about asthma control in the rising number of African children who suffer from this condition. The Achieving Control of Asthma in Children in Africa (ACACIA) study is an observational study collecting evidence about paediatric asthma in urban areas of Ghana, Malawi, Nigeria, South Afr
...


DEPARTMENT OF CONTROL OF NEGLECTED TROPICAL DISEASES

Please download the latest report from the official website:
http://www.nacp.go.tz/site/publications/epidemiology-and-research-coordination
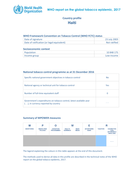
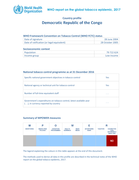
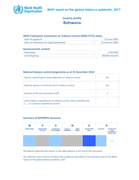
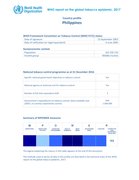
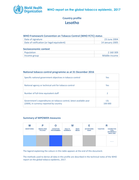
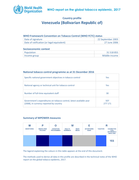
Country Profile
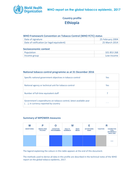
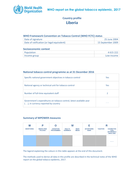
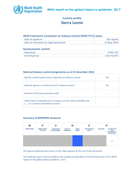
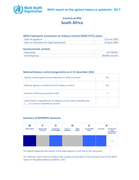
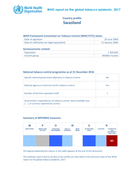
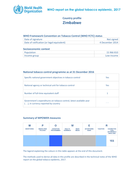
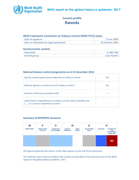
World Health Organisation Report on the global Tobacco Epidemic Rwanda Country profile (2017)
Accessed: 22.03.2019
Accessed: 28.03.2019
Diabetes is a major public health problem in the Americas and worldwide, demanding special attention and integrated response. It is estimated that more than 62 million adults are living with diabetes in the Americas. The projections show that diabetes prevalence will continue to increase to at least
...

Accessed March 14, 2017
Vol. 10 Issue 13 (2017)

The State of the world’s nursing 2020 report provides the latest, most up-to-date evidence on and policy options for the global nursing workforce. It also presents a compelling case for considerable – yet feasible – investment in nursing education, jobs, and leadership.
The primary chapters
...
Final Survey Report