Filter
2512
Text search:
population
size
estimates
Featured
158
752
Language
Document type
1575
509
218
90
63
21
12
11
5
5
2
1
Countries
131
117
81
69
67
60
54
53
52
49
49
49
45
43
41
41
38
34
30
29
28
28
26
23
22
21
21
20
19
19
18
15
15
15
13
13
12
12
11
11
10
10
9
9
8
8
8
8
8
7
6
5
5
5
5
5
5
4
4
4
4
4
4
4
3
3
3
3
3
3
3
3
3
3
3
3
2
2
2
2
2
2
2
2
2
2
2
2
2
2
1
1
1
1
1
1
1
1
1
1
1
1
1
1
1
1
1
1
1
1
1
1
1
1
1
1
1
1
Authors & Publishers
Publication Years
Category
1074
174
137
115
97
26
17
2
Toolboxes
242
152
148
137
118
79
69
51
47
46
46
44
40
39
36
34
31
30
15
8
7
7
3
2
1
DHS Further Analysis Reports No. 100

This report presents the key findings of the NFHS-5 in West Bengal, followed by detailed tables and an appendix on sampling errors. At the time of finalization of this report, wealth quintiles for the country as a whole were not ready. Therefore, on finalization of the national report, the breakup o
...
March 2021
This report presents the key findings of the NFHS-5 survey in Goa, followed by detailed tables and an appendix on sampling errors. The 2019-21 National Family Health Survey (NFHS-5), the fifth in the NFHS series, provides information on populat
...
March 2021
This report presents the key findings of the NFHS-5 survey in Maharashtra, followed by detailed tables and an appendix on sampling errors. The 2019-21 National Family Health Survey (NFHS-5), the fifth in the NFHS series, provides information on
...
March 2021
This report presents the key findings of the NFHS-5 survey in Mizoram, followed by detailed tables and an appendix on sampling errors. The 2019-21 National Family Health Survey (NFHS-5), the fifth in the NFHS series, provides information on pop
...
March 2021
This report presents the key findings of the NFHS-5 survey in the National Capital Territory (NCT) of Delhi, followed by detailed tables and an appendix on sampling errors. The 2019-21 National Family Health Survey (NFHS-5), the fifth in the NFHS series, provides information on
...
March 2021
This report presents the key findings of the NFHS-5 survey in Arunachal Pradesh, followed by detailed tables and an appendix on sampling errors. The 2019-21 National Family Health Survey (NFHS-5), the fifth in the NFHS series, provides information on
...
March 2021
This report presents the key findings of the NFHS-5 survey in Tripura, followed by detailed tables and an appendix on sampling errors. The 2019-21 National Family Health Survey (NFHS-5), the fifth in the NFHS series, provides information on pop
...
March 2021
This report presents the key findings of the NFHS-5 survey in Sikkim, followed by detailed tables and an appendix on sampling errors. The 2019-21 National Family Health Survey (NFHS-5), the fifth in the NFHS series, provides information on popu
...
July 2021
This report presents the key findings of the NFHS-5 survey in Nagaland, followed by detailed tables and an appendix on sampling errors. The 2019-21 National Family Health Survey (NFHS-5), the fifth in the NFHS series, provides information on pop
...
April 2021
This report presents the key findings of the NFHS-5 survey in Assam, followed by detailed tables and an appendix on sampling errors. The 2019-21 National Family Health Survey (NFHS-5), the fifth in the NFHS series, provides information on popul
...
July 2021
This report presents the key findings of the NFHS-5 survey in Meghalaya, followed by detailed tables and an appendix on sampling errors. The 2019-21 National Family Health Survey (NFHS-5), the fifth in the NFHS series, provides information on po
...
March 2021
This report presents the key findings of the NFHS-5 survey in Manipur, followed by detailed tables and an appendix on sampling errors. The 2019-21 National Family Health Survey (NFHS-5), the fifth in the NFHS series, provides information on pop
...
May 2021
This report presents the key findings of the NFHS-5 survey in Andhra Pradesh, followed by detailed tables and an appendix on sampling errors. The 2019-21 National Family Health Survey (NFHS-5), the fifth in the NFHS series, provides information on
...
March 2021
This report presents the key findings of the NFHS-5 survey in Kerala, followed by detailed tables and an appendix on sampling errors. The 2019-21 National Family Health Survey (NFHS-5), the fifth in the NFHS series, provides information on popu
...
December 2022
This report presents the key findings of the NFHS-5 survey in Tamil Nadu, followed by detailed tables and an appendix on sampling errors. The 2019-21 National Family Health Survey (NFHS-5), the fifth in the NFHS series, provides information on
...
May 2021
This report presents the key findings of the NFHS-5 survey in Telangana, followed by detailed tables and an appendix on sampling errors. The 2019-21 National Family Health Survey (NFHS-5), the fifth in the NFHS series, provides information on pop
...
August 2021
This report presents the key findings of the NFHS-5 survey in Jharkhand, followed by detailed tables and an appendix on sampling errors. The 2019-21 National Family Health Survey (NFHS-5), the fifth in the NFHS series, provides information on
...
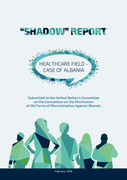
Submitted to the United Nation's Committee on the Convention on the Elimination
of All Forms of Discrimination Against Women
February 2016
Published by the Albanian Center for Population and Development (ACPD) Adresa : Bul “ Gjergj Fishta�
...

UNFPA aims to achieve three world-changing results by 2030, the deadline for achieving the Sustainable Development Goals. These are: Ending unmet need for family planning, ending gender-based violence including harmful practices such as female genital mutilation and child marriage, and ending all pr
...
UNFPA has been implementing programming for women and girls through Women Friendly Health Spaces (WFHSs), which provide access to critical services, information and support. The WFHS is providing: psychosocial counseling services; awareness raising sessions on PSS in the community; and life skills &
...

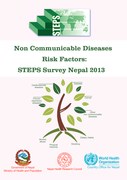
Further analysis of the Nepal Demographic and Health Surveys, 2001-2011
Further analysis of the 2011 Nepal Demographic and Health Survey
Adolescence is a critical stage in life for physical, cognitive and emotional development, shaping future health and well-being. Comprehensive measurement of adolescent health is essential to prioritize health issues, guide interventions and track progress. However, global, regional and national ado
...
Given that only 1.52 million of the 8.75 million people living with type 1 diabetes around the world in 2022 were less than 20 years old, the lack of data available for adult populations presents a stark gap in the research. Without rapid diagnosis and appropriate treatment, type 1 diabetes leads to
...
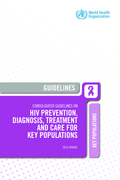
Key population brief.
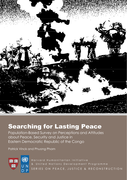
Population-Based Survey on Perceptions and Attitudes about Peace, Security and Justice in Eastern Democratic Republic of the Congo
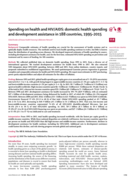
Background: Comparable estimates of health spending are crucial for the assessment of health systems and to optimally deploy health resources. The methods used to track health spending continue to evolve, but little is known about the distribution o
...
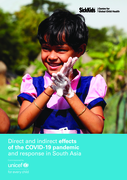
It estimates that there have been 228,000 additional deaths of children under five in these six countries [Afghanistan, Nepal, Bangladesh, India, Pakistan and Sri Lanka] due to crucial services, ranging from nutrition benefits to immunisation, being
...
2016 Update
Key population
This routine assessment supports the targeting and provision of humanitarian assistance to the affected population and serves as a preliminary source to identify oblasts and hromadas hosting high numbers of IDPs.
The 2018 NDHS is a national sample survey that provides up-to-date information on demographic and health indicators. The sample was selected using a stratified, two-stage cluster design, with enumeration areas (EAs) as the sampling units for the first stage. The second stage was a complete listing o
...
The WHO Global Health Estimates show that nearly half a million deaths (493 471) occurred in the WHO European Region due to violence and injuries in 2016. This represents a decline of 29% from 2000. Injuries account for 5.3% of all deaths and 9.6 of
...
The Health Equity Assessment Toolkit (HEAT) is a software application for use on desktop or laptop computers and mobile devices (minimum screen size of 7.9 inches recommended). It was developed to facilitate the assessment of within-country health i
...
Comprehensive public health action on population ageing is urgently needed. This will require fundamental shifts, not just in the things we do, but in how we think about ageing itself. The World report on ageing and health outlines a framework for a
...
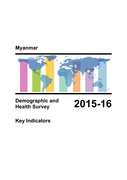
The primary objective of the 2015-16 MDHS project is to provide up-to-date estimates of basic demographic and health indicators. Specifically, the MDHS collected information on fertility levels, marriage, fertility preferences, awareness and use of
...
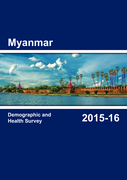
The 2015-16 MDHS is a national sample survey that provides up-to-date information on fertility levels; marriage; fertility preferences; awareness and use of family planning methods; child feeding practices; nutrition; adult and childhood mortality; awareness and attitudes regarding HIV/AIDS; women�
...
At least half of the world’s population does not have full coverage of essential health services. Health expenses push more than 100 million people into extreme poverty each and every year, forcing them into terrible choices that no one should eve
...
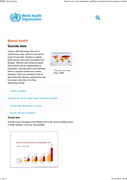
Close to 800 000 people die due to suicide every year, which is one person every 40 seconds. Suicide is a global phenomenon and occurs throughout the lifespan. Effective and evidence-based interventions can be implemented at population, sub-
...
This is a case-ascertained prospective investigation of all identified health care contacts working in a health care facility in which a laboratory confirmed 2019-nCoV infected patient (see 2.2 Study population) receives care. Note that this study c
...
About one fourth of the world’s population is estimated to have been infected with the tuberculosis (TB) bacilli, and about 5–10% of those infected develop TB disease in their lifetime. The risk for TB disease after infection depends on several
...
WHO’s antiretroviral treatment (ART) clinic-based acquired drug resistance survey method yields robust estimates of HIV viral suppression and acquired HIV drug resistance in adults, children and adolescents taking both dolutegravir and non-doluteg
...
The power relations around global decisions which shape population health can be changed through new alliances and information flows. The Democratising Global Health Governance Initiative, of which WHO Watch is a project, is designed to contribute t
...
This report complements the previous poverty analysis studies by presenting a series of poverty maps of Rwanda at cell and sector levels, based on data from EICV4 and the 2012 Population and Housing Census. A poverty map is simply a map that shows t
...
The WMH Survey Initiative is a project of the Assessment, Classification, and Epidemiology (ACE) Group at the World Health Organization coordinating the implementation and analysis of general population epidemiologic surveys of mental, substance use
...
The following protocol has been designed to investigate the First Few X cases (FFX) and their close contacts. It is envisioned that the FFX 2019-nCoV investigation will be conducted across several countries or sites with geographical and demographical diversity. Using a standardized protocol such a
...
Household transmission investigation protocol for 2019-novel coronavirus (2019-nCoV) infection
recommended
The household transmission investigation is a case-ascertained prospective study of all identified household contacts of a laboratory confirmed 2019-nCoV infection (see 2.2 Study population). It is intended to provide rapid and early information on
...
This document updates the 2014 Core Elements for Hospital Antibiotic Stewardship Programs and incorporates new evidence and lessons learned from experience with the Core Elements. The Core Elements are applicable in all hospitals, regardless of size
...
The Demographic Dividend study on Rwanda assessed the socio-economic and human development potential of our country in the short, medium and long-term period using a comprehensive approach. It generated relevant policy and programme information to guide a well-informed polciy required to propel Rwan
...
In 2017, the World Bank and partners created the Global Investment Framework for Nutrition as a roadmap towards achieving the World Health Assembly (WHA) nutrition targets by 2025. The framework estimates that the world needs to mobilize an annual a
...
The survey is representative of the Union Territory, its states and regions and urban and rural areas. It was conducted in all the districts and in 296 of the 330 townships of Myanmar. A total of 13,730 households were interviewed. It collects data on the occupations of people, how much income they
...
This 10th edition of the Institute for Health Metrics and Evaluation’s annual Financing Global Health report provides the most up-to-date estimates of development assistance for health, domestic spending on health, health spending on two key infec
...
In In recent years, China has increased its international engagement in health. Nonetheless, the lack
of data on contributions has limited efforts to examine contributions from China. Existing estimates that track
development assistance for health
...
Survey report
Four health surveys were performed in Kutupalong Makeshift Settlment (KMS), Balukhali Makeshift Settlement (BMS), Kutupalong Makeshift Settlement Extension (KMS Extension) and Balukhali Makeshift Settlement Extension (BMS Extension). These sites were chosen to ensure that the health ...
Four health surveys were performed in Kutupalong Makeshift Settlment (KMS), Balukhali Makeshift Settlement (BMS), Kutupalong Makeshift Settlement Extension (KMS Extension) and Balukhali Makeshift Settlement Extension (BMS Extension). These sites were chosen to ensure that the health ...
This report summarizes the findings of the 2010 Rwanda Demographic and Health Survey (RDHS). The 2010 Rwanda Demographic and Health Survey (RDHS) was designed to provide data for monitoring the population and health situation in Rwanda. The 2010 RDH
...
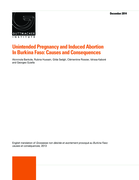
Induced abortion is permitted in Burkina Faso only to save the life and protect the health of a
pregnant woman, or in cases of rape, incest, and severe fetal impairment. As a result, the vast
majority of women who end unintended pregnancies do so in secrecy, out of fear of prosecution
and to avoi
...
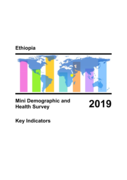
This Key Indicators report presents selected findings of the 2019 EMDHS. A comprehensive analysis of the data will be publishedin a final report in 2019.T he primary objective of the 2019 EMDHS project is to provide up-to-date estimates of key demog
...

WHO Guideline on use of ferritin concentrations to assess iron status in individuals and populations
This guideline provides global, evidence-informed recommendations on the use of indicators for assessing a population’s
iron status and application of the use of ferritin concentrations for monitoring and evaluating iron interventions.
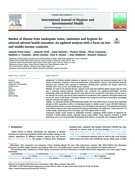
Int J Hyg Environ Health. 2019 Jun; 222(5): 765–777. doi: 10.1016/j.ijheh.2019.05.004;
To develop updated estimates in response to new exposure and exposure-response data of the
burden of diarrhoea, respiratory infections, malnutrition, schisto
...
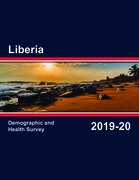
The LDHS provides an opportunity to inform policy and provide data for planning, implementation, and monitoring and evaluation of national health programs. It is designed to provide up-to-date information on health indicators including fertility levels, sexual activity, fertility preferences, awaren
...
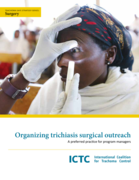
A key component of elimination is to reduce the number
of unmanaged trachomatous trichiasis cases to less than
1 per 1,000 population in affected areas. This will require
not only a large increase in the number of surgeries
performed, but also i
...
Reporting period: January 2014 – December 2014
The human immunodeficiency virus (HIV) epidemic in Myanmar is concentrated among men who have sex with men (MSM), people who inject drugs (PWID) and female sex workers (FSW). HIV prevalence in the adult ...
The human immunodeficiency virus (HIV) epidemic in Myanmar is concentrated among men who have sex with men (MSM), people who inject drugs (PWID) and female sex workers (FSW). HIV prevalence in the adult ...
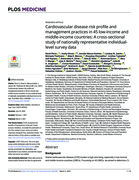
Global cardiovascular disease (CVD) burden is high and rising, especially in low-income and middle-income countries (LMICs). Focussing on 45 LMICs, we aimed to determine (1) the adult population’s median 10-year predicted CVD risk, including its v
...
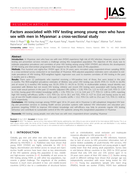
Journal of the International AIDS Society 2017, vol. 20:e25026
In Myanmar, men who have sex with men (MSM) experience high risk of HIV infection. However, access to HIV testing and prevention services remains a challenge among this marginalized popula ...
In Myanmar, men who have sex with men (MSM) experience high risk of HIV infection. However, access to HIV testing and prevention services remains a challenge among this marginalized popula ...
PEPFAR Malawi’s Country Operational Plan 2022 (COP22) embodies joint priorities from national and subnational dialogues building on the 2020-2025 National Strategic Plan for HIV/AIDS. The interagency team has developed a person-centered, district-tailored and Malawi
...
Millennium Development Goal 8E aims for affordable access to essential medicines. Essential medicines, as defined by WHO, are those that “satisfy the health-care needs of the majority of the population” and that should therefore “be available
...
This report recounts the experiences of 27 physicians and other health workers in Syria (all but two of them Syrian) who struggle to provide trauma care and health services to a population under assault.
(August 28 – October 10, 2017)
A nutrition and mortality assessment using SMART methodology was applied and the survey covered 15 statistical (14 districts plus 1) domains countrywide. The main objective of the survey was to assess the current nutrition status of the ...
A nutrition and mortality assessment using SMART methodology was applied and the survey covered 15 statistical (14 districts plus 1) domains countrywide. The main objective of the survey was to assess the current nutrition status of the ...