Filter
4109
Text search:
national
statistics
Featured
182
1343
Language
Document type
2789
730
192
109
96
78
54
28
13
13
3
2
Countries
174
137
136
125
122
117
106
102
102
98
96
89
88
85
84
82
79
61
60
59
59
57
52
52
51
50
49
49
48
43
41
40
39
34
34
33
24
24
21
21
20
20
19
18
18
17
14
14
14
13
13
13
13
13
12
11
11
11
10
10
10
9
9
9
9
8
8
8
8
8
7
7
7
6
6
6
5
5
5
5
4
4
4
4
4
4
3
3
3
3
3
3
3
3
3
3
3
3
2
2
2
2
2
2
2
2
2
2
2
2
2
2
2
2
2
2
2
1
1
1
1
1
1
1
1
1
1
1
1
1
1
1
1
1
1
1
1
1
1
1
1
1
Authors & Publishers
Publication Years
Category
2320
185
171
113
112
50
15
4
Toolboxes
267
229
228
190
147
134
96
78
75
75
62
61
54
52
47
39
34
33
13
9
9
8
8
4
1
1
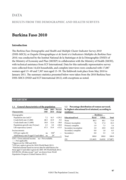
The Burkina Faso Demographic and Health and Multiple Cluster Indicator Survey 2010 (DHS-MICS), or Enquête Démographique et de Santé et à Indicateurs Multiples du Burkina Faso 2010, was conducted by the Institut National de la Statistique et de
...
Since the release of the first volume in May 2020, the COVID-19 pandemic has continued to rage around the world. By mid-March, 2021, countries around the globe had reported over 123 million cases—a nearly five-fold increase since this report’s previous volume—and over 2.7 million deaths attrib
...
WHO Mortality Database
recommended
Interactive platform visualizing mortality data. The WHO Mortality Database is a compilation of mortality data by country and area, year, sex, age and cause of death, as transmitted annually by national authorities from their civil registration and
...
Measuring violence against women with disability
recommended
This briefing note, which focuses on the measurement of violence against women with disability, is one in a series of methodological cbriefing notes for strengthening the measurement and data collection of violence against particular groups of women or specific aspects of violence against women. The
...
This briefing note, which focuses on the measurement of violence against women 60 years and older, is one in a series of methodological briefing notes for strengthening the measurement and data collection of violence against particular groups of women or specific aspects of violence against women .
...
This report presents the most current data on four specific forms of violence – violent discipline and exposure to domestic abuse during early childhood; violence at school; violent deaths among adolescents; and sexual violence in childhood and adolescence. The
...
The World Health Organization's Global Health Observatory (GHO) provides comprehensive data on noncommunicable diseases (NCDs), including cardiovascular diseases, cancers, chronic respiratory diseases, and diabetes. The portal offers country-specific stati
...
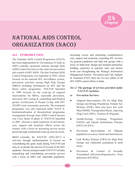
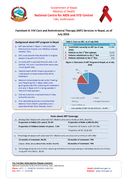
National estimates have been developed every two years since 2003, led by the NCASC with close collaboration from a range of technical experts, partners and epidemiologists from the UNAIDS, WHO and FHI. This contains information about estimations of
...

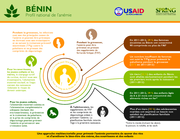
Bénin - Profil national de l'anémie (2011-2012)

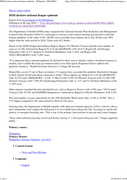
The Department of Health (DOH) today requested the National Disaster Risk Reduction and Management Council Chair Secretary Delfin N. Lorenzana to convene a full council meeting and declared a national
...
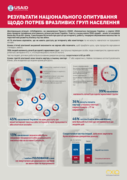
InfoSapiens research agency, commissioned by USAID Economic Resilience Activity, conducted a telephone survey in different regions of Ukraine in August 2022. A total of 1,000 women and men aged 16 to 60+ were asked about access to the Internet, jobs, gender-based violence, and business prospects dur
...
National Tuberculosis Programme (NTP) is functioning with Regional/State TB centers and 101 vertical TB teams. The NTP covered all 325 townships with DOTS strategy in November 2003 and all 330 townships including five new townships established in Na
...
Mohamed et al. BMC Public Health 2018, 18(Suppl 3):1215
https://doi.org/10.1186/s12889-018-6053-xpre-
Le Burkina Faso est un des rares pays où le secteur de la santé est très explicitement considéré comme vital pour le développement global du pays et bénéficie d’un haut niveau d’engagement de la part des plus hautes autorités de
l’Etat.
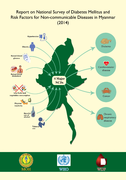
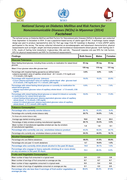
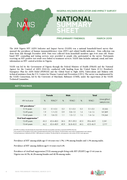
The Ministry of Health conducted STEPS surveys on adult risk factors surveillance in Myanmar in 2003, 2009 and 2014. Amongst these three surveys, the 2014 one is the most comprehensive, providing an analysis of all States and Regions within Myanmar through not only questionnaires and physical measur
...
No publication year indicated

Follow up to the Maseru Declaration. ZIMBABWE COUNTRY REPORT
Reporting Period: January 2013 - December 2013

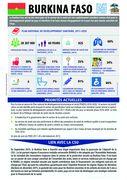
Plan du Bulletin
I- Variation des principaux indicateurs entre Janvier-Septembre_2016 et Janvier-
Septembre_2017
II- Niveau des Indicateurs au 30 Septembre 2017
A. Le niveau des indicateurs de morbidité et de mortalité
B. Carte score Paludisme au 30 Septembre 2017
C. Indicateurs
...
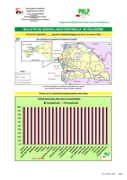
N° B.S.E.P_06/2018 _____Semaine épidémiologique du 05 au 11 Février 2018
Technical Report
The survey, conducted between March 1–10, 2018, assessed the performance of 104 public and 33 private hospitals in Venezuela. According to the figures, most laboratory services and hospital nutrition services are only available intermittently or are completely inoperative. Shortages of items such
...
L'objectif de ce rapport est de faciliter la diffusion et l'utilisation rapides des résultats de la MICS Urbaine de Dakar avant la publication des tableaux complets et du rapport final de l'enquête qui contiendront des informations détaillées sur tous les résultats de l'enquête selon diverse
...
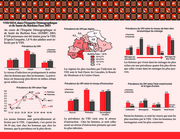
VIH/SIDA dans l’Enquête Démographique et de Santé du Burkina Faso 2003
Au cours de l’Enquête Démographique et
de Santé du Burkina Faso (EDSBF) 2003,
8 559 personnes ont été testées pour le VIH.
D’après l’enquête, 1,8 % des adultes sont infectés par le VIH.
Arunachal Pradesh, Assam, Manipur, Meghalaya, Mizoram, Nagaland, Sikkim, Tripura
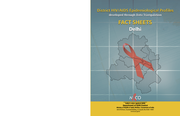
This technical document consists of epidemiological profiles (fact-sheets) for States and districts based on information available from multiple data sources including the HIV Sentinel Surveillance (HSS) and the In ...
This technical document consists of epidemiological profiles (fact-sheets) for States and districts based on information available from multiple data sources including the HIV Sentinel Surveillance (HSS) and the In ...
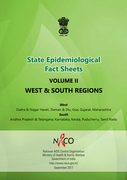
West: Drada & Nagar Haveli, Daman & Diu, Goa, Gujarat, Maharashtra
South: Andhra Pradesh & Telangana, Karnataka, Kerala, Puducherry, Tamil Nadu
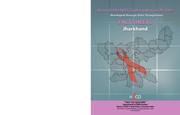
This technical document consists of epidemiological profiles (fact-sheets) for States and districts based on information available from multiple d ...
South: Andhra Pradesh & Telangana, Karnataka, Kerala, Puducherry, Tamil Nadu
This technical document consists of epidemiological profiles (fact-sheets) for States and districts based on information available from multiple d ...

Northern: Chandigarh, Delhi, Haryana, Himachal Pradesh, Jammu & Kashmir, Punjab, Rajasthan, and Uttarakhand
Central: Chhattisgarh, Madhya Pradesh and Uttar Pradesh
Eastern: Andaman & Nicobar, Bihar, Jharkhand, Odisha and West Bengal
This technical document consists of epidemiological ...
Central: Chhattisgarh, Madhya Pradesh and Uttar Pradesh
Eastern: Andaman & Nicobar, Bihar, Jharkhand, Odisha and West Bengal
This technical document consists of epidemiological ...
Ce rapport présente les principaux résultats de la quatrième édition de Enquête Démographique et de Santé du Bénin
(EDSB-IV), réalisée de décembre 2011 à mars 2012 par l’Institut National de la Statistique et de l’Analyse
Économiq
...
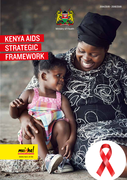
The Kenya Strategic AIDS Framework IV prioritises key populations for interventions
Data received as of July 3, 2017 | WHO and UNICEF estimates of national immunization coverage - next revision available July 15, 2018
Report on the nutrition and health situation of Nigeria
Data collection – 13th July to 13th September 2015
Data collection – 13th July to 13th September 2015
Statistical Report No 25: 2014
South African Health Review 2019
recommended
22nd edition
The purpose of the SAHR has always been to analyse and assess progress and challenges in key areas of the health system, and to propose recommendations for improvement. We are pleased to continue this tradition in the 2019 edition, which presents a unique collection of perspectives on
...
Statistical Report No 24: 2014
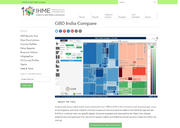
Global Burden of Disease (GBD) India Compare
recommended
Analyze data about India’s health levels and trends from 1990 to 2016 in this interactive tool. Use treemaps, maps, arrow diagrams, and other charts to compare causes and risks and explore patterns and trends by age and sex. Drill from a national
...
Since independence (1961) the Government through the Department of Social welfare has been providing services to people with disabilities without a comprehensive policy. The adoption of the National Policy on Disability (NPD) is the outcome of many
...
Diabetes country profiles 2016 - The aim of the diabetes country profiles is to synthesize, in one reference document, the national status of diabetes prevention and control. Each profile includes data on diabetes prevalence and trends; mortality; r
...
No publication date indicated.
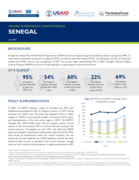
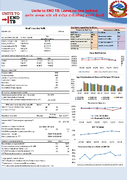
Senegal has adopted the World Health Organization’s (WHO’s) three-pronged strategy for combating malaria in pregnancy (MiP): (1) intermittent preventative treatment in pregnancy (IPTp)1 via directly observed therapy (DOT), (2) distribution and use of insecticidetreated nets (ITNs), and (3) case
...
22nd edition
Each of the 20 chapters deals with aspects of the UHC journey, dedicated towards an equitable and inclusive national health system that leaves no-one behind. While some authors describe the fundamental changes and practical considerati
...
Disposer d’une information sanitaire de qualité est une quête
permanente de la DGESS du Ministère de la santé. Le niveau de
qualité des données de routine du système national d’information
sanitaire bien qu’en amélioration ces derni
...
Le suivi évaluation des interventions en santé passe par une meilleure lisibilité de l’analyse situationnelle. Une capitalisation du niveau d’atteintes des indicateurs est nécessaire pour traduire la situation sanitaire. Le présent tableau de bord de santé décrit cette situation à traver
...
The WHO country office for Ghana, began the year 2019 with a 4-day staff retreat at the Busua Beach Resort in the Western Region from 04 to 08 March 2019. The theme for the retreat was ‘Impacting the Health and Lives of the people of Ghana through the Triple Billion Goal”. The staff outlined pri
...

Malnutrition in childhood and pregnancy has many adverse consequences for child survival and long-term well-being. It
also has far-reaching consequences for human capital, economic productivity, and national development overall. The
consequences o
...
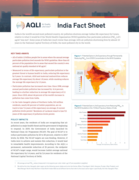
India is the world’s second most polluted country. Air pollution shortens average Indian life expectancy by 5 years,
relative to what it would be if the World Health Organization (WHO) guideline fine particulate pollution (PM2.5) of 5 μg/m3 was met. Some areas of India fare much worse than avera
...
Towards a Healthier Botswana
Enhancing Men’s Role in HIV Prevention