Filter
1177
Text search:
charts
Featured
113
353
Language
Document type
742
133
127
61
56
25
12
10
4
3
2
1
1
Countries
101
48
33
33
32
30
30
30
27
22
22
20
19
17
17
16
15
13
12
11
10
9
8
7
7
7
7
7
6
6
6
5
5
4
4
4
4
4
4
4
4
3
3
3
3
2
2
2
2
2
2
2
2
2
2
1
1
1
1
1
1
1
1
1
1
1
1
1
1
1
1
1
1
1
1
1
1
1
1
Authors & Publishers
Publication Years
Category
535
113
112
74
68
55
9
1
Toolboxes
67
65
65
52
45
36
32
32
30
27
23
20
20
17
14
12
10
9
8
7
4
4
1
1
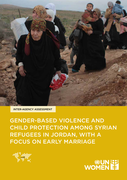
Findings from this report reveal that, rates of early marriage are high, a significant percentage of children contribute to the household’s income or are its main source of income, and restrictions on the mobility of women and girls constrain their participation in social and economic activities a
...

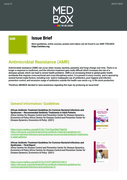
Issue Brief 31: Antimicrobial resistance (AMR) can occur when viruses, bacteria, parasites and fungi change over time. There is no longer a response to medicines, and the infection treatment gets really difficult which increases the risk of a disesase spread, which can lead to severe health problems
...
2nd edition


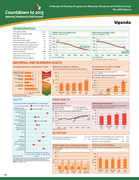
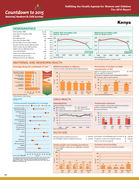
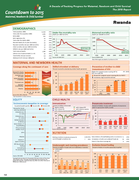
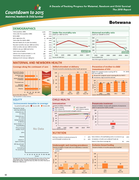
Countdown to 2015
For versions in Arabic, Russian, French, Spanish, Turkish and German go to http://www.patienten-information.de/kurzinformationen/diabetes/diabetes-und-augen
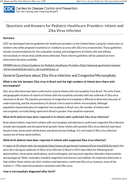
Interim guidelines developed by CDC for healthcare providers in the United States caring for infants born to mothers who while pregnant traveled to or resided in an area with Zika virus transmission. These guidelines include recommendations for the evaluation, testing, and management of infants with
...
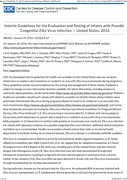
A printable copy of the article published in Morbidity and Mortality Weekly Report (MMWR) can be found on the CDC Homepage. Follow the Download Link for redirection to CDC.
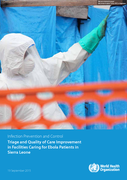
Empowering Health Workers to Improve Service Delivery. This training program is designed to build the capacity of program managers and health providers in quality management, and improve the provision of high-quality health services.
Please download the chapters directly from the website: https://w
...
The Lancet Global Health: DOI: http://dx.doi.org/10.1016/S2214-109X(16)30098-5
Open Access
Effective implementation of WHO PEN, combined with other very cost effective population-wide interventions, will help even resource constrained settings to attain the global voluntary targets related to reduction of premature mortality and preventionof heart attacks and strokes.

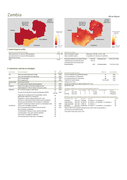
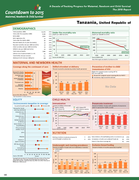
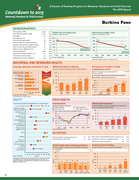
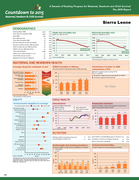
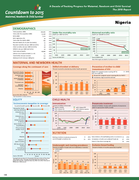
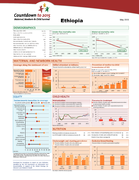
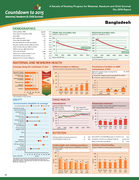
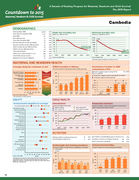
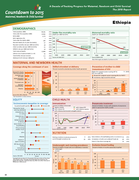
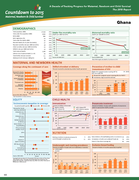
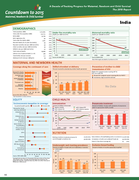
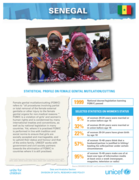
The Countdown country profile presents in one place the best and latest evidence to enable an assessment of a country’s progress in improving reproductive, maternal, newborn, and child health (RMNCH)
A guide for Regional Workshop and Hospital Technicians

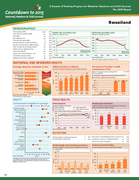
The Countdown country profile presents in one place the best and latest evidence to enable an assessment of a country’s progress in improving reproductive, maternal, newborn, and child health (RMNCH)
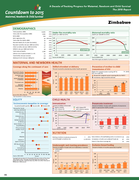
The Countdown country profile presents in one place the best and latest evidence to enable an assessment of a country’s progress in improving reproductive, maternal, newborn, and child health (RMNCH)
The Countdown country profile presents in one place the best and latest evidence to enable an assessment of a country’s progress in improving reproductive, maternal, newborn, and child health (RMNCH)
The Countdown country profile presents in one place the best and latest evidence to enable an assessment of a country’s progress in improving reproductive, maternal, newborn, and child health (RMNCH)
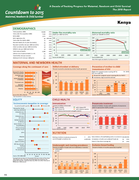
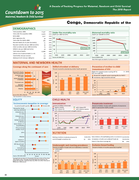
A Decade of Tracking Progress for Maternal, Newborn and Child Survival The 2015 Report


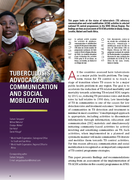
This paper looks at the status of tuberculosis (TB) advocacy
communication and social mobilization (ACSM) activities in selected
national TB control programmes in the WHO African Region. The
findings are from an assessment of TB ACSM activities in Ghana, Kenya,
Lesotho, Malawi and South Africa.
...

The Countdown country profile presents in one place the best and latest evidence to enable an assessment of a country’s progress in improving reproductive, maternal, newborn, and child health (RMNCH)
Accessed November 2017
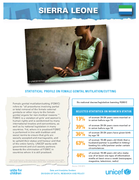
Achieving Quality Health Care in Bangladesh:
2014 Bangladesh Health Facility Survey (BHFS)
This monograph presents 12 reports of successful programs serving children with special needs in various nations. The program locations and the program report titles and authors are as follows: (1) Austria: "Integration Models for Elementary and Secondary Schools in Austria" (Volker Rutte)
...

CBM Strategy Overview
The Countdown country profile presents in one place the best and latest evidence to enable an assessment of a country’s progress in improving reproductive, maternal, newborn, and child health (RMNCH)
The Countdown country profile presents in one place the best and latest evidence to enable an assessment of a country’s progress in improving reproductive, maternal, newborn, and child health (RMNCH)
The Countdown country profile presents in one place the best and latest evidence to enable an assessment of a country’s progress in improving reproductive, maternal, newborn, and child health (RMNCH)
The Countdown country profile presents in one place the best and latest evidence to enable an assessment of a country’s progress in improving reproductive, maternal, newborn, and child health (RMNCH)

The Countdown country profile presents in one place the best and latest evidence to enable an assessment of a country’s progress in improving reproductive, maternal, newborn, and child health (RMNCH)
The Countdown country profile presents in one place the best and latest evidence to enable an assessment of a country’s progress in improving reproductive, maternal, newborn, and child health (RMNCH)
The Countdown country profile presents in one place the best and latest evidence to enable an assessment of a country’s progress in improving reproductive, maternal, newborn, and child health (RMNCH)
The Countdown country profile presents in one place the best and latest evidence to enable an assessment of a country’s progress in improving reproductive, maternal, newborn, and child health (RMNCH)

The Countdown country profile presents in one place the best and latest evidence to enable an assessment of a country’s progress in improving reproductive, maternal, newborn, and child health (RMNCH)

The Countdown country profile presents in one place the best and latest evidence to enable an assessment of a country’s progress in improving reproductive, maternal, newborn, and child health (RMNCH)

The Countdown country profile presents in one place the best and latest evidence to enable an assessment of a country’s progress in improving reproductive, maternal, newborn, and child health (RMNCH)
The Countdown country profile presents in one place the best and latest evidence to enable an assessment of a country’s progress in improving reproductive, maternal, newborn, and child health (RMNCH)
The Countdown country profile presents in one place the best and latest evidence to enable an assessment of a country’s progress in improving reproductive, maternal, newborn, and child health (RMNCH)
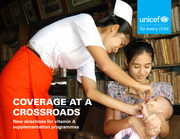
In where under-five mortality is high and vitamin A deficiency is a public health problem, two high-dose supplements of vitamin A per year, spaced four to six months apart, can strengthen children’s immune systems and improve their chances of survival.
During much of early childhood – from ...
During much of early childhood – from ...
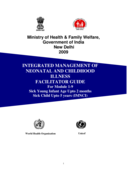
The purpose of this ‘Facilitator Guidebook’ is to help the Course Coordinator deliver and document consistently high-quality CBDRR training courses.
- Module 1: Understanding the Basics: introduces the participants to the basics of CBDRR implementation of MRCS, general aspects of CBDRR in ...
- Module 1: Understanding the Basics: introduces the participants to the basics of CBDRR implementation of MRCS, general aspects of CBDRR in ...
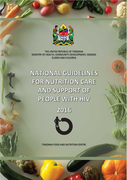
The current guidelines on Integrated Management of Acute Malnutrition (IMAM), addresses the issue of improved management of severe acute malnutrition (SAM), particularly in children under 5 years of age. In the absence of standard protocols, mortality in children admitted to hospital with SAM can ra
...


The main objective of the malaria prevention and control programme in Somalia is to prevent mortality and reduce morbidity due to malaria. The groups most vulnerable to the disease, children aged under 5 years and pregnant women, are especially targeted. Effective case management - early diagnosis a
...
CBM strategy overview paper on preventing physical impairment in childhood.
Adolescent alcohol-related behaviours: trends and inequalities in the WHO European Region, 2002–2014
Observations from the Health Behaviour in School-aged Children (HBSC) WHO collaborative cross-national study
In this entry we are looking at smoking, alcohol consumption and the use of illicit drugs. We are studying who is using these substances, how their use has changed over time, and we are presenting the estimates of their impact on health. Collectively, smoking, alcohol and illicit drug use kills 11.8
...
The Healthy Activity Program manual aims at providing counsellors like you with information about counselling patients with moderate to severe Depression in primary care settings.
In den unterschiedlichsten Alltagssituationen werden wir heutzutage als KonsumentInnen angesprochen. Darunter fallen allein 2.500 bis 10.000 Werbebot-schaften, die den Deutschen jeden Tag begegnen. Wie selbstverständlich durchdringen Konsumprodukte unser Leben, welches ohne sie kaum vorstellbar ist
...

11/6/08 2:36:52 PM
st_ma_media.indd
www.raisingvoices.org/sasa.php
Accessed: 17.11.2019

A Summary
Accessed: 23.11.2019
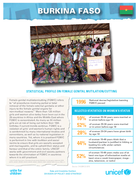
Female genital mutilation/cutting (FGM/C) refers to “all procedures involving partial or total removal of the female external genitalia or other injury to the female genital organs for non-medical reasons.”1 FGM/C is a violation of girls’ and women’s human rights and is condemned by many int
...
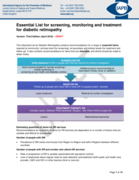
3rd edition April 2018 - draft version
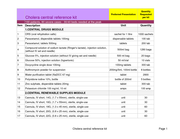
This Essential List for Diabetic Retinopathy contains recommendations for a range of essential itemsrequired at community / primary level (for screening); at secondary and tertiary levels (for treatment and follow up). It also contains recommendations for i
...
Female genital mutilation/cutting (FGM/C) refers to “all procedures involving partial
or total removal of the female external genitalia or other injury to the female
genital organs for non-medical reasons.”FGM/C is a violation of girls’ and women’s
human rights and is condemned by many in
...
Accessed: 08.03.2020
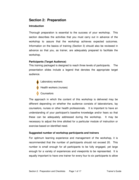
Thorough preparation is essential to the success of your workshop. This section describes the activities that you must carry out in advance of the workshop to assure that the workshop achieves expected outcomes. Information on the basics of training (Section 3) should also be
...

Participant Manual
February 2011
Edition 3.0

Burkina Faso has approximately 10.5 million inhabitants and is divided into 30 provinces. The study took place in the districts of Tougan, Nouna, and Solenzo, in provinces Sourou and Kossi, in north-west Burkina Faso. There is one medical centre in every district capital and 6 to 14 health centres i
...
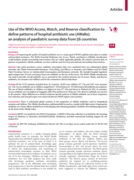
Improving the quality of hospital antibiotic use is a major goal of WHO’s global action plan to combat antimicrobial resistance. The WHO Essential Medicines List Access, Watch, and Reserve (AWaRe) classification could facilitate simple stewardship interventions that are widely applicable globally.
...
Patients with suspected coronavirus disease 2019 (COVID-19) can infect others at any time, including during transfer and transport. COVID-19 is a new infectious disease that requires contact and droplet precautions; lapses in infection prevention and control (IPC) can easily happen at vulnerable mom
...
30 January 2020
This document outlines the standard operating procedures for detection and response to case/s of suspected novel coronavirus disease (2019-nCoV) in South Africa. The content of this document should inform provincial preparedness plans.