Filter
3411
Text search:
health
and
demographic
data
Featured
162
1162
Language
3315
58
46
28
16
15
10
7
3
2
2
2
1
1
1
1
1
1
1
1
1
1
1
1
1
1
1
1
1
1
1
1
1
1
Document type
2305
619
184
97
79
56
22
22
14
7
2
1
Countries
161
142
126
116
105
102
101
97
96
93
87
79
78
76
73
67
65
56
53
53
50
49
48
47
46
34
34
33
31
26
25
25
20
20
20
18
18
17
17
17
15
14
13
13
12
12
12
11
11
10
10
10
10
10
9
8
7
7
7
7
7
7
7
7
7
7
6
6
5
5
5
5
5
4
4
4
4
4
4
4
3
3
3
3
2
2
2
2
2
2
2
2
2
2
2
2
2
1
1
1
1
1
1
1
1
1
1
1
1
1
1
1
1
1
1
1
1
1
1
1
1
1
1
1
1
1
Authors & Publishers
280
165
112
108
91
75
72
64
52
40
34
26
22
21
21
21
19
18
17
16
15
14
14
14
14
13
12
12
12
12
11
10
10
10
10
10
10
10
9
9
9
9
9
9
9
8
8
8
8
8
7
7
7
7
7
7
7
7
7
7
7
7
7
7
7
7
6
6
6
6
6
6
6
6
6
6
6
6
6
6
6
5
5
5
5
5
5
5
5
5
5
5
5
5
5
5
5
5
5
5
5
5
5
5
5
5
5
4
4
4
4
4
4
4
4
4
4
4
4
4
4
4
4
4
4
4
4
4
4
4
4
4
4
4
4
4
4
4
4
4
4
4
4
4
3
3
3
3
3
3
3
3
3
3
3
3
3
3
3
3
3
3
3
3
3
3
3
3
3
3
3
3
3
3
3
3
3
3
3
3
3
3
3
3
3
3
3
3
3
3
3
3
3
3
3
3
3
3
3
3
3
3
3
3
3
3
3
3
3
3
3
3
3
3
3
3
3
3
3
3
3
3
3
3
3
3
2
2
2
2
2
2
2
2
2
2
2
2
2
2
2
2
2
2
2
2
2
2
2
2
2
2
2
2
2
2
2
2
2
2
2
2
2
2
2
2
2
2
2
2
2
2
2
2
2
2
2
2
2
2
2
2
2
2
2
2
2
2
2
2
2
2
2
2
2
2
2
2
2
2
2
2
2
2
2
2
2
2
2
2
2
2
2
2
2
2
2
2
2
2
2
2
2
2
2
2
2
2
2
2
2
2
2
2
2
2
2
2
2
2
2
2
2
2
2
2
2
2
2
2
2
2
2
2
2
2
2
2
2
2
2
2
2
2
2
2
2
2
2
2
2
2
2
2
2
2
2
2
2
2
2
2
2
2
2
2
2
2
2
2
2
2
2
2
2
2
2
2
2
2
2
2
2
2
2
2
2
2
2
2
2
2
2
2
2
2
2
2
2
2
2
2
2
2
2
2
2
2
2
2
2
2
2
2
2
2
2
2
2
2
2
2
2
2
2
2
2
2
2
2
2
2
2
2
1
1
1
1
1
1
1
1
1
1
1
1
1
1
1
1
1
1
1
1
1
1
1
1
1
1
1
1
1
1
1
1
1
1
1
1
1
1
1
1
1
1
1
1
1
1
1
1
1
1
1
1
1
1
1
1
1
1
1
1
1
1
1
1
1
1
1
1
1
1
1
1
1
1
1
1
1
1
1
1
1
1
1
1
1
1
1
1
1
1
1
1
1
1
1
1
1
1
1
1
1
1
1
1
1
1
1
1
1
1
1
1
1
1
1
1
1
1
1
1
1
1
1
1
1
1
1
1
1
1
1
1
1
1
1
1
1
1
1
1
1
1
1
1
1
1
1
1
1
1
1
1
1
1
1
1
1
1
1
1
1
1
1
1
1
1
1
1
1
1
1
1
1
1
1
1
1
1
1
1
1
1
1
1
1
1
1
1
1
1
1
1
1
1
1
1
1
1
1
1
1
1
1
1
1
1
1
1
1
1
1
1
1
1
1
1
1
1
1
1
1
1
1
1
1
1
1
1
1
1
1
1
1
1
1
1
1
1
1
1
1
1
1
1
1
1
1
1
1
1
1
1
1
1
1
1
1
1
1
1
1
1
1
1
1
1
1
1
1
1
1
1
1
1
1
1
1
1
1
1
1
1
1
1
1
1
1
1
1
1
1
1
1
1
1
1
1
1
1
1
1
1
1
1
1
1
1
1
1
1
1
1
1
1
1
1
1
1
1
1
1
1
1
1
1
1
1
1
1
1
1
1
1
1
1
1
1
1
1
1
1
1
1
1
1
1
1
1
1
1
1
1
1
1
1
1
1
1
1
1
1
1
1
1
1
1
1
1
1
1
1
1
1
1
1
1
1
1
1
1
1
1
1
1
1
1
1
1
1
1
1
1
1
1
1
1
1
1
1
1
1
1
1
1
1
1
1
1
1
1
1
1
1
1
1
1
1
1
1
1
1
1
1
1
1
1
1
1
1
1
1
1
1
1
1
1
1
1
1
1
1
1
1
1
1
1
1
1
1
1
1
1
1
1
1
1
1
1
1
1
1
1
1
1
1
1
1
1
1
1
1
1
1
1
1
1
1
1
1
1
1
1
1
1
1
1
1
1
1
1
1
1
1
1
1
1
1
1
1
1
1
1
1
1
1
1
1
1
1
1
1
1
1
1
1
1
1
1
1
1
1
1
1
1
1
1
1
1
1
1
1
1
1
1
1
1
1
1
1
1
1
1
1
1
1
1
1
1
1
1
1
1
1
1
1
1
1
1
1
1
1
1
1
1
1
1
1
1
1
1
1
1
1
1
1
1
1
1
1
1
1
1
1
1
1
1
1
1
1
1
1
1
1
1
1
1
1
1
1
1
1
1
1
1
1
1
1
1
1
1
1
1
1
1
1
1
1
1
1
1
1
1
1
1
1
1
1
1
1
1
1
1
1
1
1
1
1
1
1
1
1
1
1
1
1
1
1
1
1
1
1
1
1
1
1
1
1
1
1
1
1
1
1
1
1
1
1
1
1
1
1
1
1
1
1
1
1
1
1
1
1
1
1
1
1
1
1
1
1
1
1
1
1
1
1
1
1
1
1
1
1
1
1
1
1
1
1
1
1
1
1
1
1
1
1
1
1
1
1
1
1
1
1
1
1
1
1
1
1
1
1
1
1
1
1
1
1
1
1
1
1
1
1
1
1
1
1
1
1
1
1
1
1
1
1
1
1
1
1
1
1
1
1
1
1
1
1
1
1
1
1
1
1
1
1
1
1
1
1
1
1
1
1
1
1
1
1
1
1
1
1
1
1
1
1
1
1
1
1
1
1
1
1
1
1
1
1
1
1
1
1
1
1
1
1
1
1
1
1
1
1
1
1
1
1
1
1
1
1
1
1
1
1
1
1
1
1
1
1
1
1
1
1
1
1
1
1
1
1
1
1
1
1
1
1
1
1
1
1
1
1
1
1
1
1
1
1
1
1
1
1
1
1
1
1
1
1
1
1
1
1
1
1
1
1
1
1
1
1
1
1
1
1
1
1
1
1
1
1
1
1
1
1
1
1
1
1
1
1
1
1
1
1
1
1
1
1
1
1
1
1
1
1
1
1
1
1
1
1
1
1
1
1
1
1
1
1
1
1
1
1
1
1
1
1
1
1
1
1
1
1
1
1
1
1
1
1
1
1
1
1
1
1
1
1
1
1
1
1
1
1
1
1
1
1
1
1
1
1
1
1
1
1
1
1
1
1
1
1
1
1
1
1
1
1
1
1
1
1
1
1
1
1
1
1
1
1
1
1
1
1
1
1
1
1
1
1
1
1
1
1
1
1
1
1
1
1
1
1
1
1
1
1
1
1
1
1
1
1
1
1
1
1
1
1
1
1
1
1
1
1
1
1
1
1
1
1
1
1
1
1
1
1
1
1
1
1
1
1
1
1
1
1
1
1
1
1
1
1
1
1
1
1
1
1
1
1
1
1
1
1
1
1
1
1
1
1
1
1
1
1
1
1
1
1
1
1
1
1
1
1
1
1
1
1
1
1
1
1
1
1
1
1
1
1
1
1
1
1
1
1
1
1
1
1
1
1
1
1
1
1
1
1
1
1
1
1
1
1
1
1
1
1
1
1
1
1
1
1
1
1
1
1
1
1
1
1
1
1
1
1
1
1
1
1
1
1
1
1
1
1
1
1
1
1
1
1
1
1
1
1
1
1
1
1
1
1
1
1
1
1
1
1
1
1
1
1
1
1
1
1
1
1
1
1
1
1
1
1
1
1
1
1
1
1
1
1
1
1
1
1
1
1
1
1
1
1
1
1
1
1
1
1
1
1
1
1
1
1
1
1
1
1
1
1
1
1
1
1
1
1
1
1
1
1
1
1
1
1
1
1
1
1
1
1
1
1
1
1
1
1
1
1
1
1
1
1
1
1
1
1
1
1
1
1
1
1
1
1
1
1
1
1
1
1
1
1
1
1
1
1
1
1
1
1
1
1
1
1
1
1
1
1
1
1
1
1
1
1
1
1
1
1
1
1
1
1
1
1
1
1
1
1
1
1
1
1
1
1
1
1
1
1
1
1
1
1
1
1
1
1
1
1
1
1
1
1
1
1
1
1
1
1
1
1
1
1
1
1
1
1
1
1
1
1
1
1
1
1
1
1
1
1
1
1
1
1
1
1
1
1
1
1
1
1
1
1
1
1
1
1
1
1
1
1
1
1
1
1
1
1
1
1
1
1
1
1
1
1
1
1
1
1
1
1
1
1
1
1
1
1
1
1
1
1
1
1
1
1
1
1
1
1
1
1
1
1
1
1
1
1
1
1
1
1
1
1
1
1
1
1
1
1
1
1
1
1
1
1
1
1
1
1
1
1
1
1
1
1
1
1
1
1
1
1
1
1
1
1
1
1
1
1
1
1
1
1
1
1
1
1
1
1
1
1
1
1
1
1
1
1
1
1
1
1
1
1
1
1
1
1
1
1
1
1
1
1
1
1
1
1
1
1
1
1
1
1
1
1
1
1
1
1
1
1
1
1
1
1
1
1
1
1
1
1
1
1
1
1
1
1
1
1
1
1
1
1
1
1
1
1
1
1
1
1
1
1
1
1
1
1
1
1
1
1
1
1
1
1
1
1
1
1
1
1
1
1
1
1
1
1
1
1
1
1
1
1
1
1
1
1
1
1
1
1
1
1
1
1
1
1
1
1
1
1
1
1
1
1
1
1
1
1
1
1
1
1
1
1
1
1
1
1
1
1
1
1
1
1
1
1
1
1
1
1
1
1
1
1
1
1
1
1
1
1
1
1
1
1
1
1
1
1
1
1
1
1
1
1
1
1
1
1
1
1
1
1
1
1
1
1
1
1
1
1
1
1
1
1
1
1
1
1
1
1
1
1
1
1
1
1
1
1
1
1
1
1
1
1
1
1
1
1
1
1
1
1
1
1
1
1
1
1
1
1
1
1
1
1
1
1
1
1
1
1
1
1
1
1
1
1
1
1
1
1
1
1
1
1
1
1
1
1
1
1
1
1
1
1
1
1
1
1
1
1
1
1
1
1
1
1
1
1
1
1
1
1
1
1
1
1
1
1
1
1
1
1
1
1
1
1
1
1
1
1
1
1
1
1
1
1
1
1
1
1
1
1
1
1
1
1
1
1
1
1
1
1
1
1
1
1
1
1
1
1
1
1
1
1
1
1
1
1
1
1
1
1
1
1
1
1
1
1
1
1
1
1
1
1
1
1
1
1
1
1
1
1
1
1
1
1
1
1
1
1
1
1
1
1
1
1
1
1
1
1
1
1
1
1
1
1
1
1
1
1
1
1
1
1
1
1
1
1
1
1
1
1
1
1
1
1
1
1
1
1
1
1
1
1
1
1
1
1
1
1
1
1
1
1
1
1
1
1
1
1
1
1
1
1
1
1
1
1
1
1
1
1
1
1
1
1
1
1
1
1
1
1
1
1
1
1
1
1
1
1
1
1
1
1
1
1
1
1
1
1
1
1
1
1
1
1
1
1
1
1
1
1
1
1
1
1
1
1
1
1
1
1
1
1
1
1
1
1
1
1
1
1
1
1
1
1
1
1
1
1
1
1
1
1
1
1
1
1
1
1
1
1
1
1
1
1
1
1
1
1
1
1
1
1
1
1
1
1
1
1
1
1
1
1
1
1
1
1
1
1
1
1
1
1
1
1
1
1
1
1
1
1
1
1
1
1
1
1
1
1
1
1
1
1
1
1
1
1
1
1
1
1
1
1
1
1
1
1
1
1
1
1
1
1
1
1
1
1
1
1
1
1
1
1
1
1
1
1
1
1
1
1
1
1
1
1
1
1
1
1
1
1
1
1
1
1
1
1
1
1
1
1
1
1
1
1
1
1
1
1
1
1
1
1
1
1
1
1
1
1
1
1
1
1
1
1
1
1
1
1
1
1
1
1
1
1
1
1
1
1
1
1
1
1
1
1
1
1
1
1
1
1
1
1
1
1
1
1
1
1
1
1
1
1
1
1
1
1
1
1
1
1
1
1
1
1
1
1
1
1
1
1
1
1
1
1
1
1
1
1
1
1
1
1
1
1
1
1
1
1
1
1
1
1
1
1
1
1
1
1
1
1
1
1
1
1
1
1
1
1
1
1
1
1
1
1
1
1
1
1
1
1
1
1
1
1
1
1
1
1
1
1
1
1
1
1
1
1
1
1
1
1
1
1
1
1
1
1
1
1
1
1
1
1
1
1
1
1
1
1
1
1
1
1
1
1
1
1
1
1
1
1
1
1
1
1
1
1
1
1
1
1
1
1
1
1
1
1
1
1
1
1
1
1
1
1
1
1
1
1
1
1
1
1
1
1
1
1
1
1
1
1
1
1
1
1
1
1
1
1
1
1
1
1
1
1
1
1
1
1
1
1
1
1
1
1
1
1
1
1
1
1
1
1
1
1
1
1
1
1
1
1
1
1
1
1
1
1
1
1
1
1
1
1
1
1
1
1
1
1
1
1
1
1
1
1
1
1
1
1
1
1
1
1
1
1
1
1
1
1
1
1
1
1
1
1
1
1
1
1
1
1
1
1
1
1
1
1
1
1
1
1
1
1
1
1
1
1
1
1
1
1
1
1
1
1
1
1
1
1
1
1
1
1
1
1
1
1
1
1
1
1
1
1
1
1
1
1
1
1
1
1
1
1
1
1
1
1
1
1
1
1
1
1
1
1
1
1
1
1
1
1
1
1
1
1
1
1
1
1
1
1
1
1
1
1
1
1
1
1
1
1
1
1
1
1
1
1
1
1
1
1
1
1
1
1
1
1
1
1
1
1
1
1
1
1
1
1
1
1
1
1
1
1
1
1
1
1
1
1
1
1
1
1
1
1
1
1
1
1
1
1
1
1
1
1
1
1
1
1
1
1
1
1
1
1
1
1
1
1
1
1
1
1
1
1
1
1
1
1
1
1
1
1
1
1
1
1
1
1
1
1
1
1
1
1
1
1
1
1
1
1
1
1
1
1
1
1
1
1
1
1
1
1
1
1
1
1
1
1
1
1
1
1
1
1
1
1
1
1
1
1
1
1
1
1
1
1
1
1
1
1
1
1
1
1
1
1
1
1
1
1
1
1
1
1
1
1
1
1
1
1
1
1
1
1
1
1
1
1
1
1
1
1
1
1
1
1
1
1
1
1
1
1
1
1
1
1
1
1
1
1
1
1
1
1
1
1
1
1
1
1
1
1
1
1
1
1
1
1
1
1
1
1
1
1
1
1
1
1
1
1
1
1
1
1
1
1
1
1
1
1
1
1
1
1
1
1
1
1
1
1
1
1
1
1
1
1
1
1
1
1
1
1
1
1
1
1
1
1
1
1
1
1
1
1
1
1
1
1
1
1
1
1
1
1
1
1
Publication Years
658
2481
262
7
2
1
Category
1921
188
166
138
88
28
13
5
Toolboxes
254
202
148
115
111
109
65
61
56
55
54
53
50
47
46
25
23
21
11
11
7
5
4
1

DEMOGRAPHIC AND HEALTH SURVEYS DHS WORKING PAPERS 2015 No. 117
Demographic Health Survey Working Paper 2017 No. 130
Further Analysis of the 2000, 2005, and 2011 Demographic and Health Surveys. DHS Further Analysi
...
s Reports No. 79
more

DHS Working Papers No. 69
This paper uses data from the three Indian National Family Health Surveys (1992-93, 1998-99, 2005-06) to examine how the relationship between household wealth ... and child mortality evolved during a time of significant economic change in India. The main predictor is a new measure of household wealth that captures changes in wealth over time. Outcomes include neonatal mortality, postneonatal mortality, child mortality, and under-five mortality. Multivariate analysis is conducted at the national, urban, rural, and regional levels.
Results indicate that the overall relationship between household wealth and mortality weakened over time, as evidenced by the coefficients for under-five mortality at the national level. more
HIV/AIDS surveillance in Europe 2017
A. Pharris; A. Stengaard
World Health Organization (Europe); European Centre for Disease Prevention and Control
(2017)
C_WHO
2016 data
The report was coordinated by Anastasia Pharris and Annemarie Stengaard.
Report review and production support were provided by Andr
...
ew J. Amato-Gauci, Mike Catchpole, Denis Coulombier, Masoud Dara, Nedret Emiroglu, Rachel Katterl, Shahin Khasiyev, Valentina Lazdina, Teymur Noori, Marc Rondy, Chantal Quintin, Phillip Zucs.
more
The report presents the latest data on more than 50 health-related Sustainable Development Goal and "triple billion" target indicators. The 2021 ed
...
ition includes preliminary estimates for global excess deaths attributable to COVID-19 for 2020 and the state of global and regional health trends from 2000-2019. It also focuses on persistent health inequalities and data gaps that have been accentuated by the pandemic, with a call to urgently invest in health information systems to ensure the world is better prepared with better data.
more
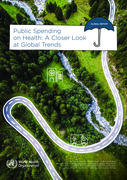
The 2020 Report analyzes global health spending for 190 countries from 2000 to 2018 and provides insights as to the health spending trajectory from
...
the MDG era to the SDG era prior to the crisis of 2020. The report shows that global spending on health continually rose between 2000 and 2018 and reached US$ 8.3 trillion or 10% of global GDP. The data also show that out-of-pocket spending has remained high in low and lower-middle income countries, representing greater than 40% of total health spending in 2018. We also report and summarize the data on expenditures for PHC, as well as by disease and intervention, including for immunization. The report also analyzes the available data on budget allocation in response to the COVID-19 crisis. In addition, we combine World Bank/IMF projections of the macroeconomic and fiscal impact of the crisis with an analysis of the historical determinants of health spending patterns and UHC indicators, and based on this, we draw out the likely implications of 2020 for future health spending, highlighting key policy and monitoring concerns.
more
Levels and Inequities
DHS Further Analysis Reports No. 110
This study shows large variations in maternal health indicators across high-priority counties in Kenya. Nairobi exceeds the natio ... nal average on all maternal health indicators in this study, while other highpriority counties consistently are disadvantaged compared with Kenya as a whole in most maternal health indicators. Kisumu exceeds the national average in use of antenatal care, delivery in a health facility, and postnatal care, but not other indicators. Nakuru has fewer women with fertility risk and fewer women who report that the distance they must travel to reach a health facility is a problem.
This study identifies a number of inequities in maternal health indicators across socio-demographic characteristics in the high-priority counties—most in the distribution of delivery care and least in antenatal care. Inequities are also observed in fertility risk and postnatal care. more
The global burden of disease (GBD) study provides information about fatal and non-fatal health outcomes around the world.
The objective of this work is to describe the burden of mental disorders am
...
ong children aged 5–14 years in each of the six regions of the World Health Organisation. Data come from the GBD 2015 study. Outcomes: disability-adjusted life-years (DALYs) are the main indicator of GBD studies and are built from years of life lost (YLLs) and years of life lived with disability (YLDs).
more
The Kabeho Mwana project (2006–2011) supported the Rwanda Ministry of Health (MOH) in scaling up integrated community case management (iCCM) of childhood illness in 6 of Rwanda’s 30 districts. The project trained
...
and equipped community health workers (CHWs) according to national guidelines. In project districts, Kabeho Mwana staff also trained CHWs to conduct household-level health promotion and established supervision and reporting mechanisms through CHW peer support groups (PSGs) and quality improvement systems. The iCCM model implemented by Kabeho Mwana resulted in greater improvements in care-seeking than those seen in the rest of the country. Intensive monitoring, collaborative supervision, community mobilization, and CHW PSGs contributed to this success. The PSGs were a unique contribution of the project, playing a critical role in improving care-seeking in project districts. Effective implementation of iCCM should therefore include CHW management and social support mechanisms. Finally, re-analysis of national survey data improved evaluation findings by providing impact estimates.
more

Access to Services and Barriers faced by People with Disabilities: A Quantitative Survey
Nathan Grills, Lawrence Singh, Hira Pant, Jubin Varghese, GVS Murthy, Monsurul Hoq, Manjula Marella
Disability, CBR & Inclusive Development Journal (DCIDJ)
(2017)
CC
In low- and middle-income middle-income countries, reliable and disaggregated disability data on prevalence, participation
...
and barriers are often unavailable. This study aimed to estimate disability prevalence, determine associated socio-demographic factors and compare access in the community between people with and without disability in Dehradun district of Uttarakhand, India, using the Rapid Assessment of Disability survey.
more
This booklet provides an overview of all findings from the Global Burden of Disease 2017 study. Published in The Lancet in November 2018, GBD 2017 provides for the first time an independent estimation of population, for each of 195 countries and ter
...
ritories and the globe, using a standardized, replicable approach, as well as a comprehensive update on fertility. Produced with the input of 3,676 collaborators from 146 countries and territories, GBD 2017 incorporates major data additions and improvements, and methodological refinements. GBD 2017 also includes estimates at the subnational level for selected locations.
more
The objective of Health in the Americas: Overview of the Region of the Americas in the Context of the COVID-19 Pandemic is to respond to the need to address important public health issues in an incr
...
easingly timely manner, while serving as a platform with a close focus on specific issues of regional importance. This 2022 edition is the second in its new format, providing an overview of the analysis, as well as an in-depth description of the key issues related to COVID-19 in the Region of the Americas. This overview is supported by the Health in the Americas+ virtual platform, which offers interactive resources for data analysis and allows for the comparison of information disaggregated by subregions and countries.
more
The 2018 global health financing report presents health spending data for all WHO Member States between 2000
...
and 2016 based on the SHA 2011 methodology. It shows a transformation trajectory for the global spending on health, with increasing domestic public funding and declining external financing. This report also presents, for the first time, spending on primary health care and specific diseases and looks closely at the relationship between spending and service coverage
more
In a prospective cohort study in Bangwe primary care clinic, Blantyre, Malawi, all adults (18 years or older) presenting with an acute illness were screened for TB symptoms (cough, fever, night sweats, weight loss). Demographic characteristics were
...
linked to exit interview by fingerprint bioidentification. Multivariable logistic regression models were constructed to estimate the proportion completing same-visit HIV testing, comparing between those with and without TB symptoms.
more
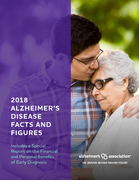
Includes a Special Report on the Financial and Personal Benefits of Early Diagnosis
2018 Alzheimer’s Disease Facts and Figures is a statistical resource for U.S.
...
data related to Alzheimer’s disease,
the most common cause of dementia. Background and context for interpretating the data are contained in
the Overview. Additional sections address prevalence, mortality and morbidity, caregiving and use and costs of health care and services. A Special Report discusses the financial and personal benefits of diagnosing earlier in the disease process, in the stage of mild cognitive impairment.
more
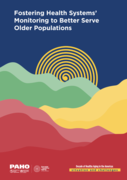
The chapter Fostering Health Systems’ Monitoring to Better Serve Older Populations is part of the publication series entitled Decade of Healthy Aging: Situation and Challenges. The publications ar
...
e designed to favor the prioritization of effective actions at the local level as well as the monitoring of data and public health policies, and providing evidence-based information. Along with the objective of presenting the available updated knowledge about the situation of health and aging at the beginning of the Decade of Healthy Aging in the Americas, this publication gives information about health systems’ monitoring to better serve the needs of older adults and emphasizes the need for societies and health systems to better adapt to an aging population. It introduces the 360-tool as a guide to adapt health systems through monitoring tracers/indicators and highlighting the data and information that is readily available, disaggregated by age. This information can aid in decision-making and resource allocation to support older adults’ needs. Concerning the 360-tool development, a consensus has been reached on seven tracer indicators with high relevance to informing policy, and case studies in selected countries have assessed the feasibility of this approach. The list of indicators and the process related to the development of the tool are presented in this publication. The Decade of Healthy Aging 2021-2030 is a period to guide action towards the transformation of societies by fostering the inclusion of older people in every decision. This publication intends to contribute to this strategy and highlight the upcoming challenges and opportunities on healthy aging.
more
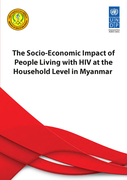
The Socio-Economic Impact of People Living with HIV at the Household Level in Myanmar
Cercone, James; Pinder, Étoile; Pothuis, Michal et al.
The Republic of the Union of Myanmar, Ministry of Health and Sports; UNDP
(2016)
C1
The study collected data on the impact of HIV-related diseases on income, revenues, economic dependency, consumption, education, health, food security, stigma, discrimination, quality of life,
...
and migration. The study also assessed people living with chronic diseases in order to compare the impact of living with HIV/AIDS with the impact of living with a chronic disease.
Stigma, discrimination, and socio-economic exclusion continue to affect the rights and socio-economic opportunities of people living with HIV in Myanmar. Households with a family member who has HIV, have lower incomes, fewer assets and lower home-ownership, compared to households that are not affected by HIV. They also have more household debt, and their families pay a higher rate of interest compared to families not affected by HIV. more
Stigma, discrimination, and socio-economic exclusion continue to affect the rights and socio-economic opportunities of people living with HIV in Myanmar. Households with a family member who has HIV, have lower incomes, fewer assets and lower home-ownership, compared to households that are not affected by HIV. They also have more household debt, and their families pay a higher rate of interest compared to families not affected by HIV. more
Whole-genome sequencing (WGS) provides a vast amount of information and the highest possible resolution for pathogen subtyping. The application of WGS for global surveillance can provide information on the early emergence
...
and spread of AMR and further inform timely policy development on AMR control. Sequencing data emanating from AMR surveillance may provide key information to guide the development of rapid diagnostic tools for better and more rapid characterization of AMR, and thus complement phenotypic methods. This document addresses the applications of WGS for AMR surveillance, including the benefits and limitations of current WGS technologies
more
An estimated 1.3 billion people globally experience significant disability. This figure has grown over the last decade and will continue to rise due to demographic
...
and epidemiological changes. In 2022, the World Health Organization launched the Global report on health equity for persons with disabilities. This report demonstrated that many persons with disabilities are still being left behind. Experiencing persistent health inequities, persons with disabilities die earlier, they have poorer health and functioning, and they are more affected by health emergencies than the general population. These differences are largely associated with unjust factors both inside and beyond the health sector and are avoidable. The Global Report called upon Member States to take actions to make health sector more inclusive for persons with disabilities through the primary health care approach. This will be essential for countries to make health coverage truly universal and to progress towards other health-related targets in the sustainable development goals.
more