Filter
2615
Text search:
human
development
index
Featured
226
831
Language
2482
56
52
50
32
26
20
18
15
7
4
4
4
4
3
3
3
3
3
3
3
2
2
2
2
2
2
1
1
1
1
1
1
1
1
1
1
1
1
1
1
1
1
1
Document type
1646
504
230
98
73
24
19
12
5
3
1
Countries
118
104
102
76
75
71
65
63
60
59
58
56
56
48
45
43
39
37
37
35
32
31
31
27
26
25
24
21
21
19
19
18
17
17
16
15
15
14
14
12
12
11
11
11
11
9
9
9
7
7
7
7
7
7
6
6
5
5
5
5
5
5
5
5
4
4
4
4
4
4
4
4
3
3
3
3
3
3
3
3
3
3
3
2
2
2
2
2
2
2
2
2
2
2
2
2
2
2
2
2
1
1
1
1
1
1
1
1
1
1
1
1
1
1
1
1
1
1
1
1
1
1
1
1
1
1
1
1
1
1
1
1
1
Authors & Publishers
279
116
112
69
63
56
49
42
40
38
35
18
17
16
15
15
13
13
13
12
11
11
11
11
11
11
11
10
10
10
9
9
8
8
8
8
8
7
7
7
7
7
6
6
6
6
6
6
6
6
5
5
5
5
5
5
5
5
5
5
5
5
5
5
5
5
5
5
5
5
5
5
5
5
4
4
4
4
4
4
4
4
4
4
4
4
4
4
4
4
4
4
4
4
4
4
4
4
4
4
3
3
3
3
3
3
3
3
3
3
3
3
3
3
3
3
3
3
3
3
3
3
3
3
3
3
3
3
3
3
3
3
3
3
3
3
3
3
3
3
3
3
3
3
3
3
3
3
3
3
3
3
3
3
3
3
3
3
3
3
3
3
3
3
3
3
3
3
3
3
3
3
3
3
3
3
3
2
2
2
2
2
2
2
2
2
2
2
2
2
2
2
2
2
2
2
2
2
2
2
2
2
2
2
2
2
2
2
2
2
2
2
2
2
2
2
2
2
2
2
2
2
2
2
2
2
2
2
2
2
2
2
2
2
2
2
2
2
2
2
2
2
2
2
2
2
2
2
2
2
2
2
2
2
2
2
2
2
2
2
2
2
2
2
2
2
2
2
2
2
2
2
2
2
2
2
2
2
2
2
2
2
2
2
2
2
2
2
2
2
2
2
2
2
2
2
2
2
2
2
2
2
2
2
2
2
2
2
2
2
2
2
2
2
2
2
2
2
2
2
2
2
2
2
2
2
2
2
2
2
2
2
2
2
2
2
2
2
2
2
2
2
2
2
2
2
2
2
2
2
2
1
1
1
1
1
1
1
1
1
1
1
1
1
1
1
1
1
1
1
1
1
1
1
1
1
1
1
1
1
1
1
1
1
1
1
1
1
1
1
1
1
1
1
1
1
1
1
1
1
1
1
1
1
1
1
1
1
1
1
1
1
1
1
1
1
1
1
1
1
1
1
1
1
1
1
1
1
1
1
1
1
1
1
1
1
1
1
1
1
1
1
1
1
1
1
1
1
1
1
1
1
1
1
1
1
1
1
1
1
1
1
1
1
1
1
1
1
1
1
1
1
1
1
1
1
1
1
1
1
1
1
1
1
1
1
1
1
1
1
1
1
1
1
1
1
1
1
1
1
1
1
1
1
1
1
1
1
1
1
1
1
1
1
1
1
1
1
1
1
1
1
1
1
1
1
1
1
1
1
1
1
1
1
1
1
1
1
1
1
1
1
1
1
1
1
1
1
1
1
1
1
1
1
1
1
1
1
1
1
1
1
1
1
1
1
1
1
1
1
1
1
1
1
1
1
1
1
1
1
1
1
1
1
1
1
1
1
1
1
1
1
1
1
1
1
1
1
1
1
1
1
1
1
1
1
1
1
1
1
1
1
1
1
1
1
1
1
1
1
1
1
1
1
1
1
1
1
1
1
1
1
1
1
1
1
1
1
1
1
1
1
1
1
1
1
1
1
1
1
1
1
1
1
1
1
1
1
1
1
1
1
1
1
1
1
1
1
1
1
1
1
1
1
1
1
1
1
1
1
1
1
1
1
1
1
1
1
1
1
1
1
1
1
1
1
1
1
1
1
1
1
1
1
1
1
1
1
1
1
1
1
1
1
1
1
1
1
1
1
1
1
1
1
1
1
1
1
1
1
1
1
1
1
1
1
1
1
1
1
1
1
1
1
1
1
1
1
1
1
1
1
1
1
1
1
1
1
1
1
1
1
1
1
1
1
1
1
1
1
1
1
1
1
1
1
1
1
1
1
1
1
1
1
1
1
1
1
1
1
1
1
1
1
1
1
1
1
1
1
1
1
1
1
1
1
1
1
1
1
1
1
1
1
1
1
1
1
1
1
1
1
1
1
1
1
1
1
1
1
1
1
1
1
1
1
1
1
1
1
1
1
1
1
1
1
1
1
1
1
1
1
1
1
1
1
1
1
1
1
1
1
1
1
1
1
1
1
1
1
1
1
1
1
1
1
1
1
1
1
1
1
1
1
1
1
1
1
1
1
1
1
1
1
1
1
1
1
1
1
1
1
1
1
1
1
1
1
1
1
1
1
1
1
1
1
1
1
1
1
1
1
1
1
1
1
1
1
1
1
1
1
1
1
1
1
1
1
1
1
1
1
1
1
1
1
1
1
1
1
1
1
1
1
1
1
1
1
1
1
1
1
1
1
1
1
1
1
1
1
1
1
1
1
1
1
1
1
1
1
1
1
1
1
1
1
1
1
1
1
1
1
1
1
1
1
1
1
1
1
1
1
1
1
1
1
1
1
1
1
1
1
1
1
1
1
1
1
1
1
1
1
1
1
1
1
1
1
1
1
1
1
1
1
1
1
1
1
1
1
1
1
1
1
1
1
1
1
1
1
1
1
1
1
1
1
1
1
1
1
1
1
1
1
1
1
1
1
1
1
1
1
1
1
1
1
1
1
1
1
1
1
1
1
1
1
1
1
1
1
1
1
1
1
1
1
1
1
1
1
1
1
1
1
1
1
1
1
1
1
1
1
1
1
1
1
1
1
1
1
1
1
1
1
1
1
1
1
1
1
1
1
1
1
1
1
1
1
1
1
1
1
1
1
1
1
1
1
1
1
1
1
1
1
1
1
1
1
1
1
1
1
1
1
1
1
1
1
1
1
1
1
1
1
1
1
1
1
1
1
1
1
1
1
1
1
1
1
1
1
1
1
1
1
1
1
1
1
1
1
1
1
1
1
1
1
1
1
1
1
1
1
1
1
1
1
1
1
1
1
1
1
1
1
1
1
1
1
1
1
1
1
1
1
1
1
1
1
1
1
1
1
1
1
1
1
1
1
1
1
1
1
1
1
1
1
1
1
1
1
1
1
1
1
1
1
1
1
1
1
1
1
1
1
1
1
1
1
1
1
1
1
1
1
1
1
1
1
1
1
1
1
1
1
1
1
1
1
1
1
1
1
1
1
1
1
1
1
1
1
1
1
1
1
1
1
1
1
1
1
1
1
1
1
1
1
1
1
1
1
1
1
1
1
1
1
1
1
1
1
1
1
1
1
1
1
1
1
1
1
1
1
1
1
1
1
1
1
1
1
1
1
1
1
1
1
1
1
1
1
1
1
1
1
1
1
1
1
1
1
1
1
1
1
1
1
1
1
1
1
1
1
1
1
1
1
1
1
1
1
1
1
1
1
1
1
1
1
1
1
1
1
1
1
1
1
1
1
1
1
1
1
1
1
1
1
1
1
1
1
1
1
1
1
1
1
1
1
1
1
1
1
1
1
1
1
1
1
1
1
1
1
1
1
1
1
1
1
1
1
1
1
1
1
1
1
1
1
1
1
1
1
1
1
1
1
1
1
1
1
1
1
1
1
1
1
1
1
1
1
1
1
1
1
1
1
1
1
1
1
1
1
1
1
1
1
1
1
1
1
1
1
1
1
1
1
1
1
1
1
1
1
1
1
1
1
1
1
1
1
1
1
1
1
1
1
1
1
1
1
1
1
1
1
1
1
1
1
1
1
1
1
1
1
1
1
1
1
1
1
1
1
1
1
1
1
1
1
1
1
1
1
1
1
1
1
1
1
1
1
1
1
1
1
1
1
1
1
1
1
1
1
1
1
1
1
1
1
1
1
1
1
1
1
1
1
1
1
1
1
1
1
1
1
1
1
1
1
1
1
1
1
1
1
1
1
1
1
1
1
1
1
1
1
1
1
1
1
1
1
1
1
1
1
1
1
1
1
1
1
1
1
1
1
1
1
1
1
1
1
1
1
1
1
1
1
1
1
1
1
1
1
1
1
1
1
1
1
1
1
1
1
1
1
1
1
1
1
1
1
1
1
1
1
1
1
1
1
1
1
1
1
1
1
1
1
1
1
1
1
1
1
1
1
1
1
1
1
1
1
1
1
1
1
1
1
1
1
1
1
1
1
1
1
1
1
1
1
1
1
1
1
1
1
1
1
1
1
1
1
1
1
1
1
1
1
1
1
1
1
1
1
1
1
1
1
1
1
1
1
1
1
1
1
1
1
1
1
1
1
1
1
1
1
1
1
1
1
1
1
1
1
1
1
1
1
1
1
1
1
1
1
1
1
1
1
1
1
1
1
1
1
1
1
1
1
1
1
1
1
1
1
1
1
1
1
1
1
1
1
1
1
1
1
1
1
1
1
1
1
1
1
1
1
1
1
1
1
1
1
1
1
1
1
1
1
1
1
1
1
1
1
1
1
1
1
1
1
1
1
1
1
1
1
1
1
1
1
1
1
1
1
1
1
1
1
1
1
1
1
1
1
1
1
1
1
1
1
1
1
1
1
1
1
1
1
1
1
1
1
1
1
1
1
1
1
1
1
1
1
1
1
1
1
1
1
1
1
1
1
1
1
1
1
1
1
1
1
1
1
1
1
1
1
1
1
1
1
1
1
1
1
1
1
1
1
1
1
1
1
1
1
1
1
1
1
1
1
1
1
1
1
1
1
1
1
1
1
1
1
1
1
1
1
1
1
1
1
1
1
1
1
1
1
1
1
1
1
1
1
1
1
1
1
1
1
1
1
1
1
1
1
1
1
1
1
1
1
1
1
1
1
1
1
1
1
1
1
1
1
1
1
1
1
1
1
1
1
1
1
1
1
1
1
1
1
1
1
1
1
1
1
1
1
1
1
1
1
1
1
1
1
1
1
1
1
1
1
1
1
1
1
1
1
1
1
1
1
1
1
1
1
1
1
1
1
1
1
1
1
1
1
1
1
1
1
1
1
1
1
1
1
1
1
1
1
1
1
1
1
1
1
1
1
1
1
1
1
1
1
1
1
1
1
1
1
1
1
1
1
1
1
1
1
1
1
1
1
1
1
1
1
1
1
1
1
1
1
1
1
1
1
1
1
1
1
1
1
1
1
1
1
1
1
1
1
1
1
1
1
1
1
1
1
1
1
1
1
1
1
1
1
1
1
1
1
1
1
1
1
1
1
1
1
1
1
1
1
1
1
1
1
1
1
1
1
1
1
1
1
1
1
1
1
1
1
1
1
1
1
1
1
1
1
1
1
1
1
1
1
1
1
1
1
1
1
1
1
1
1
1
1
1
1
1
1
1
1
1
1
1
1
1
1
1
1
1
1
1
1
1
1
1
1
1
1
1
1
1
1
1
1
1
1
1
1
1
1
1
1
1
1
1
1
1
1
1
1
1
1
1
1
1
1
1
1
1
1
1
1
1
1
1
1
1
1
1
1
1
1
1
1
1
1
1
1
1
1
1
1
1
1
1
1
1
1
1
1
1
1
1
1
1
1
1
1
1
1
1
1
1
1
1
1
1
1
1
1
1
1
1
1
1
1
1
1
1
1
1
Publication Years
606
1784
216
9
Category
1243
210
158
117
80
42
21
1
Toolboxes
194
142
133
131
125
78
71
66
62
61
60
55
46
42
39
30
27
27
10
10
9
6
5
1
1
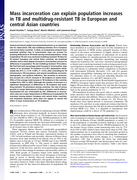
Mass incarceration can explain population increases in TB and multidrug-resistant TB in European and central Asian countries
recommended
D. Stuckler, S. Basu, M. McKee, et al.
B. H. Singer (Princeton University); National Academy of Sciences of the USA
(2008)
C2
13280–13285 / PNAS / September 9, 2008 / vol. 105 / no. 36
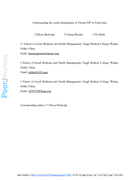
PeerJ PrePrints , http://dx.doi.org/10.7287/peerj.preprints.579v1 2 Nov 2014
This study, and similar studies in Kenya, Mozambique, Swaziland, Uganda, and Zambia is the outcome of close collaborative by a team in Swaziland, with technical and financial support from the UNAIDS Regional Support Team for Eastern and Southern Africa, UNAIDS Geneva, and the World Bank's Global HIV
...
/AIDS Program (Global AIDS Monitoring and Evaluation Team). The study entailed using existing data and collecting new data to better know the country's HIV epidemic, know the country HIV response and how funding was allocated, so as to improve the HIV response and strengthen prevention based on evidence on what works to prevent new infections.
more
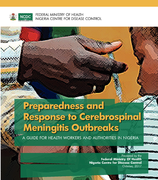
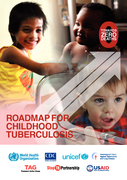
A GUIDE FOR HEALTH WORKERS AND AUTHORITIES IN NIGERIA
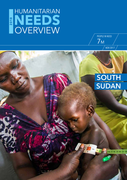
2018 South Sudan Humanitarian Needs Overview
recommended
This document provides the Humanitarian Country Team’s shared understanding of the crisis, including the most pressing
humanitarian needs and the estimated number of people who need assistance. It represents a consolidated evidence base and
helps inform joint strategic response planning.
As
...
the conflict in South Sudan enters its fifth year in 2018, the humanitarian crisis has continued to intensify and expand, on a costly trajectory for the country’s people and their outlook on the future. The compounding effects of widespread violence and sustained economic decline have further diminished the capacity of people to face threats to their health, safety and livelihoods. People in need of assistance and protection number 7 million, even as more than 2 million have fled to neighbouring countries.
more
Guatemala National Disability Study (Endis 2016) Main Report
International Centre for Evidence in Disability (ICED)
London School of Hygiene & Tropical Medicine
(2017)
C2

Chemical and Biological Agents, Nuclear Events
Smithsonian Alerts
(2018)
C2
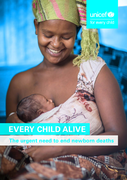
Globally, in low-income countries, the average newborn mortality rate is 27 deaths per 1,000 births, the report says. In high-income countries, that rate is 3 deaths per 1,000. Newborns from the riskiest places to give birth are up to 50 times more likely to die than those from the safest places.
... The report also notes that 8 of the 10 most dangerous places to be born are in sub-Saharan Africa, where pregnant women are much less likely to receive assistance during delivery due to poverty, conflict and weak institutions. If every country brought its newborn mortality rate down to the high-income average by 2030, 16 million lives could be saved.
More than 80 per cent of newborn deaths are due to prematurity, complications during birth or infections such as pneumonia and sepsis, the report says. These deaths can be prevented with access to well-trained midwives, along with proven solutions like clean water, disinfectants, breastfeeding within the first hour, skin-to-skin contact and good nutrition. more
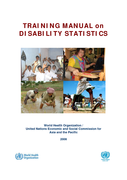
TRAINING MANUAL on DISABILITY STATISTICS
World Health Organization United Nations Economic and Social Commission for Asia and the Pacific
United Nations
(2008)
C2
WHO/ESCAP Training Manual on Disability Statistics | This training manual intends to enhance the understanding of the ICF-based approach to disability measurement. It provides an overview of the ICF framework as well as guidelines on how to operationalize the underlying concepts of functioning and
...
disability into data collection, dissemination and analysis.
more
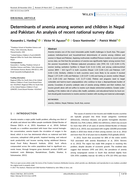
Maternal Child Nutrition. 2017;e12478
This paper analyzes individual level and household level determinants of anemia among children and women in Nepal and Pakistan. Applying multivariate modified Poisson models to recent national survey data, we find that the prevalence of anemia was significa ... ntly higher among women from the poorest households in Pakistan (adjusted prevalence ratio [95% CI]: 1.10 [1.04–1.17]), women lacking sanitation facilities in Nepal (1.22 [1.12–1.33]), and among undernourished women (BMI < 18.5 kg/m2) in both countries (Nepal: 1.10 [1.00–1.21] and Pakistan: 1.07 [1.02–1.13]). Similarly, children in both countries were more likely to be anemic if stunted (Nepal: 1.19 [1.09–1.30] and Pakistan: 1.10 [1.07–1.14]) and having an anemic mother (Nepal: 1.31 [1.20–1.42] and Pakistan: 1.21 [1.17–1.26]).
https://doi.org/10.1111/mcn.12478 more
Census Report Volume 4-K
The results of the 2014 Census collected only relates to four of the six types of disability domains recommended by the Washington Group on Disability Statistics, namely: seeing, hearing, walking, and remembering or concentrating.
Out of a total of 50.3 million pe ... rsons enumerated in the 2014 Census, there were 2.3 million persons (4.6 per cent of the total population) who reported some degree of difficulty with either one or more of the four functional domains. Of this number, over half a million (representing over 1 per cent of the population as a whole) reported having a lot of difficulty or could not do one or more of the four activities at all (referred to as severe disability). Among those with the severest degree of disability, 55 thousand were blind, 43 thousand were deaf, 99 thousand could not walk at all and 90 thousand did not have the capability to remember or concentrate.
The Census shows that disability is predominantly an old age phenomenon with its prevalence remaining low up to a certain age, after which rates increase substantially. more
Policy Brief, Updated in March 2017
Key messages
• The criminalisation of male-to-male sex heightens HIV and other sexually transmissible infection (STI) risks and vulnerabilities, and hinders access to HIV and STI services including HCT.
• Men who have sex with men (MSM) and tran ... sgender persons (TG) are not a homogeneous group. As such, a variety of HCT service models are needed to reach the various segments of these populations.
• Stigma and discrimination remain ongoing issues at a number of service points. Targeted training of service providers is therefore needed so that MSM and TG are not discouraged from seeking HCT and high-quality prevention, treatment and care services.
• Specific guidelines on HIV prevention, treatment and care services for MSM or TG help improve the delivery of services. more

Draft for consultation