Filter
4041
Text search:
male
Featured
271
1382
Language
3869
64
60
46
41
33
24
15
14
7
7
6
6
5
5
4
4
4
4
4
3
3
3
3
3
2
2
2
2
2
2
2
2
2
2
1
1
1
1
1
1
1
1
1
1
1
1
1
1
1
1
1
1
1
Document type
2832
562
305
118
71
50
42
29
12
11
7
1
1
Countries
231
146
138
117
110
108
104
94
93
92
91
91
90
83
79
74
66
56
54
54
51
49
45
44
42
40
40
40
37
30
30
28
27
26
22
21
18
18
17
17
16
15
15
15
14
14
13
13
13
13
12
11
11
11
10
10
9
9
9
9
9
8
7
7
7
7
6
6
6
6
6
6
5
5
5
5
5
5
5
5
4
4
4
4
4
4
4
3
3
3
3
3
3
3
2
2
2
2
2
2
2
2
2
2
2
2
2
2
2
2
2
1
1
1
1
1
1
1
1
1
1
1
1
1
1
1
1
1
1
1
1
1
1
1
1
1
1
Authors & Publishers
263
242
169
153
135
101
87
53
50
42
34
33
31
28
28
27
27
25
24
24
22
21
21
21
20
19
18
18
18
18
17
17
17
17
16
16
15
15
15
14
13
13
13
13
13
12
12
12
12
11
11
11
10
10
10
9
9
9
9
9
9
8
8
8
8
7
7
7
7
7
7
7
7
7
7
7
7
7
7
7
7
6
6
6
6
6
6
6
6
6
6
6
6
6
6
6
6
6
6
6
6
6
5
5
5
5
5
5
5
5
5
5
5
5
5
5
5
5
5
5
5
5
5
5
5
5
5
5
5
5
5
5
5
5
5
5
5
5
5
5
4
4
4
4
4
4
4
4
4
4
4
4
4
4
4
4
4
4
4
4
4
4
4
4
4
4
4
4
4
4
4
4
4
4
4
4
4
4
4
4
4
4
4
4
4
4
4
3
3
3
3
3
3
3
3
3
3
3
3
3
3
3
3
3
3
3
3
3
3
3
3
3
3
3
3
3
3
3
3
3
3
3
3
3
3
3
3
3
3
3
3
3
3
3
3
3
3
3
3
3
3
3
3
3
3
3
3
3
3
3
3
3
3
3
3
3
3
3
3
3
3
3
3
3
3
3
3
3
3
3
3
3
3
3
3
3
3
3
3
3
3
3
3
3
3
3
3
3
3
3
3
3
3
3
3
3
3
2
2
2
2
2
2
2
2
2
2
2
2
2
2
2
2
2
2
2
2
2
2
2
2
2
2
2
2
2
2
2
2
2
2
2
2
2
2
2
2
2
2
2
2
2
2
2
2
2
2
2
2
2
2
2
2
2
2
2
2
2
2
2
2
2
2
2
2
2
2
2
2
2
2
2
2
2
2
2
2
2
2
2
2
2
2
2
2
2
2
2
2
2
2
2
2
2
2
2
2
2
2
2
2
2
2
2
2
2
2
2
2
2
2
2
2
2
2
2
2
2
2
2
2
2
2
2
2
2
2
2
2
2
2
2
2
2
2
2
2
2
2
2
2
2
2
2
2
2
2
2
2
2
2
2
2
2
2
2
2
2
2
2
2
2
2
2
2
2
2
2
2
2
2
2
2
2
2
2
2
2
2
2
2
2
2
2
2
2
2
2
2
2
2
2
2
2
2
2
2
2
2
2
2
2
2
2
2
2
2
2
2
2
2
2
2
2
2
2
2
2
2
2
2
2
2
2
2
2
2
2
2
2
2
2
2
2
2
2
2
2
2
2
2
2
2
2
2
2
2
2
2
2
2
2
2
2
2
2
2
2
2
2
2
2
2
2
2
2
2
2
2
2
2
2
2
2
2
2
2
2
2
2
2
2
2
2
2
2
2
2
2
2
2
2
2
2
2
2
2
2
2
2
2
2
1
1
1
1
1
1
1
1
1
1
1
1
1
1
1
1
1
1
1
1
1
1
1
1
1
1
1
1
1
1
1
1
1
1
1
1
1
1
1
1
1
1
1
1
1
1
1
1
1
1
1
1
1
1
1
1
1
1
1
1
1
1
1
1
1
1
1
1
1
1
1
1
1
1
1
1
1
1
1
1
1
1
1
1
1
1
1
1
1
1
1
1
1
1
1
1
1
1
1
1
1
1
1
1
1
1
1
1
1
1
1
1
1
1
1
1
1
1
1
1
1
1
1
1
1
1
1
1
1
1
1
1
1
1
1
1
1
1
1
1
1
1
1
1
1
1
1
1
1
1
1
1
1
1
1
1
1
1
1
1
1
1
1
1
1
1
1
1
1
1
1
1
1
1
1
1
1
1
1
1
1
1
1
1
1
1
1
1
1
1
1
1
1
1
1
1
1
1
1
1
1
1
1
1
1
1
1
1
1
1
1
1
1
1
1
1
1
1
1
1
1
1
1
1
1
1
1
1
1
1
1
1
1
1
1
1
1
1
1
1
1
1
1
1
1
1
1
1
1
1
1
1
1
1
1
1
1
1
1
1
1
1
1
1
1
1
1
1
1
1
1
1
1
1
1
1
1
1
1
1
1
1
1
1
1
1
1
1
1
1
1
1
1
1
1
1
1
1
1
1
1
1
1
1
1
1
1
1
1
1
1
1
1
1
1
1
1
1
1
1
1
1
1
1
1
1
1
1
1
1
1
1
1
1
1
1
1
1
1
1
1
1
1
1
1
1
1
1
1
1
1
1
1
1
1
1
1
1
1
1
1
1
1
1
1
1
1
1
1
1
1
1
1
1
1
1
1
1
1
1
1
1
1
1
1
1
1
1
1
1
1
1
1
1
1
1
1
1
1
1
1
1
1
1
1
1
1
1
1
1
1
1
1
1
1
1
1
1
1
1
1
1
1
1
1
1
1
1
1
1
1
1
1
1
1
1
1
1
1
1
1
1
1
1
1
1
1
1
1
1
1
1
1
1
1
1
1
1
1
1
1
1
1
1
1
1
1
1
1
1
1
1
1
1
1
1
1
1
1
1
1
1
1
1
1
1
1
1
1
1
1
1
1
1
1
1
1
1
1
1
1
1
1
1
1
1
1
1
1
1
1
1
1
1
1
1
1
1
1
1
1
1
1
1
1
1
1
1
1
1
1
1
1
1
1
1
1
1
1
1
1
1
1
1
1
1
1
1
1
1
1
1
1
1
1
1
1
1
1
1
1
1
1
1
1
1
1
1
1
1
1
1
1
1
1
1
1
1
1
1
1
1
1
1
1
1
1
1
1
1
1
1
1
1
1
1
1
1
1
1
1
1
1
1
1
1
1
1
1
1
1
1
1
1
1
1
1
1
1
1
1
1
1
1
1
1
1
1
1
1
1
1
1
1
1
1
1
1
1
1
1
1
1
1
1
1
1
1
1
1
1
1
1
1
1
1
1
1
1
1
1
1
1
1
1
1
1
1
1
1
1
1
1
1
1
1
1
1
1
1
1
1
1
1
1
1
1
1
1
1
1
1
1
1
1
1
1
1
1
1
1
1
1
1
1
1
1
1
1
1
1
1
1
1
1
1
1
1
1
1
1
1
1
1
1
1
1
1
1
1
1
1
1
1
1
1
1
1
1
1
1
1
1
1
1
1
1
1
1
1
1
1
1
1
1
1
1
1
1
1
1
1
1
1
1
1
1
1
1
1
1
1
1
1
1
1
1
1
1
1
1
1
1
1
1
1
1
1
1
1
1
1
1
1
1
1
1
1
1
1
1
1
1
1
1
1
1
1
1
1
1
1
1
1
1
1
1
1
1
1
1
1
1
1
1
1
1
1
1
1
1
1
1
1
1
1
1
1
1
1
1
1
1
1
1
1
1
1
1
1
1
1
1
1
1
1
1
1
1
1
1
1
1
1
1
1
1
1
1
1
1
1
1
1
1
1
1
1
1
1
1
1
1
1
1
1
1
1
1
1
1
1
1
1
1
1
1
1
1
1
1
1
1
1
1
1
1
1
1
1
1
1
1
1
1
1
1
1
1
1
1
1
1
1
1
1
1
1
1
1
1
1
1
1
1
1
1
1
1
1
1
1
1
1
1
1
1
1
1
1
1
1
1
1
1
1
1
1
1
1
1
1
1
1
1
1
1
1
1
1
1
1
1
1
1
1
1
1
1
1
1
1
1
1
1
1
1
1
1
1
1
1
1
1
1
1
1
1
1
1
1
1
1
1
1
1
1
1
1
1
1
1
1
1
1
1
1
1
1
1
1
1
1
1
1
1
1
1
1
1
1
1
1
1
1
1
1
1
1
1
1
1
1
1
1
1
1
1
1
1
1
1
1
1
1
1
1
1
1
1
1
1
1
1
1
1
1
1
1
1
1
1
1
1
1
1
1
1
1
1
1
1
1
1
1
1
1
1
1
1
1
1
1
1
1
1
1
1
1
1
1
1
1
1
1
1
1
1
1
1
1
1
1
1
1
1
1
1
1
1
1
1
1
1
1
1
1
1
1
1
1
1
1
1
1
1
1
1
1
1
1
1
1
1
1
1
1
1
1
1
1
1
1
1
1
1
1
1
1
1
1
1
1
1
1
1
1
1
1
1
1
1
1
1
1
1
1
1
1
1
1
1
1
1
1
1
1
1
1
1
1
1
1
1
1
1
1
1
1
1
1
1
1
1
1
1
1
1
1
1
1
1
1
1
1
1
1
1
1
1
1
1
1
1
1
1
1
1
1
1
1
1
1
1
1
1
1
1
1
1
1
1
1
1
1
1
1
1
1
1
1
1
1
1
1
1
1
1
1
1
1
1
1
1
1
1
1
1
1
1
1
1
1
1
1
1
1
1
1
1
1
1
1
1
1
1
1
1
1
1
1
1
1
1
1
1
1
1
1
1
1
1
1
1
1
1
1
1
1
1
1
1
1
1
1
1
1
1
1
1
1
1
1
1
1
1
1
1
1
1
1
1
1
1
1
1
1
1
1
1
1
1
1
1
1
1
1
1
1
1
1
1
1
1
1
1
1
1
1
1
1
1
1
1
1
1
1
1
1
1
1
1
1
1
1
1
1
1
1
1
1
1
1
1
1
1
1
1
1
1
1
1
1
1
1
1
1
1
1
1
1
1
1
1
1
1
1
1
1
1
1
1
1
1
1
1
1
1
1
1
1
1
1
1
1
1
1
1
1
1
1
1
1
1
1
1
1
1
1
1
1
1
1
1
1
1
1
1
1
1
1
1
1
1
1
1
1
1
1
1
1
1
1
1
1
1
1
1
1
1
1
1
1
1
1
1
1
1
1
1
1
1
1
1
1
1
1
1
1
1
1
1
1
1
1
1
1
1
1
1
1
1
1
1
1
1
1
1
1
1
1
1
1
1
1
1
1
1
1
1
1
1
1
1
1
1
1
1
1
1
1
1
1
1
1
1
1
1
1
1
1
1
1
1
1
1
1
1
1
1
1
1
1
1
1
1
1
1
1
1
1
1
1
1
1
1
1
1
1
1
1
1
1
1
1
1
1
1
1
1
1
1
1
1
1
1
1
1
1
1
1
1
1
1
1
1
1
1
1
1
1
1
1
1
1
1
1
1
1
1
1
1
1
1
1
1
1
1
1
1
1
1
1
1
1
1
1
1
1
1
1
1
1
1
1
1
1
1
1
1
1
1
1
1
1
1
1
1
1
1
1
1
1
1
1
1
1
1
1
1
1
1
1
1
1
1
1
1
1
1
1
1
1
1
1
1
1
1
1
1
1
1
1
1
1
1
1
1
1
1
1
1
1
1
1
1
1
1
1
1
1
1
1
1
1
1
1
1
1
1
1
1
1
1
1
1
1
1
1
1
1
1
1
1
1
1
1
1
1
1
1
1
1
1
1
1
1
1
1
1
1
1
1
1
1
1
1
1
1
1
1
1
1
1
1
1
1
1
1
1
1
1
1
1
1
1
1
1
1
1
1
1
1
1
1
1
1
1
1
1
1
1
1
1
1
1
1
1
1
1
1
1
1
1
1
1
1
1
1
1
1
1
1
1
1
1
1
1
1
1
1
1
1
1
1
1
1
1
1
1
1
1
1
1
1
1
1
1
1
1
1
1
1
1
1
1
1
1
1
1
1
1
1
1
1
1
1
1
1
1
1
1
1
1
1
1
1
1
1
1
1
1
1
1
1
1
1
1
1
1
1
1
1
1
1
1
1
1
1
1
1
1
1
1
1
1
1
1
1
1
1
1
1
1
1
1
1
1
1
1
1
1
1
1
1
1
1
1
1
1
1
1
1
1
1
1
1
1
1
1
1
1
1
1
1
1
1
1
1
1
1
1
1
1
1
1
1
1
1
1
1
1
1
1
1
1
1
1
1
1
1
1
1
1
1
1
1
1
1
1
1
1
1
1
1
1
1
1
1
1
1
1
1
1
1
1
1
1
1
1
1
1
1
1
1
1
1
1
1
1
1
1
1
1
1
1
1
1
1
1
1
1
1
1
1
1
1
1
1
1
1
1
1
1
1
1
1
1
1
1
1
1
1
1
1
1
1
1
1
1
1
1
1
1
1
1
1
1
1
1
1
1
1
1
1
1
1
1
1
1
1
1
1
1
1
1
1
1
1
1
1
1
1
1
1
1
1
1
1
1
1
1
1
1
1
1
1
1
1
1
1
1
1
1
1
1
1
1
1
1
1
1
1
1
1
1
1
1
1
1
1
1
1
1
1
1
1
1
1
1
1
1
1
1
1
1
1
1
1
1
1
1
1
1
1
1
1
1
1
1
1
1
1
1
1
1
1
1
1
1
1
1
1
1
1
1
1
1
1
1
1
1
1
1
1
1
1
1
1
1
1
1
1
1
1
1
1
1
1
1
1
1
1
1
1
1
1
1
1
1
1
1
1
1
1
1
1
1
1
1
1
1
1
1
1
1
1
1
1
1
1
1
1
1
1
1
1
1
1
1
1
1
1
1
1
1
1
1
1
1
1
1
1
1
1
1
1
1
1
1
1
1
1
1
1
1
1
1
1
1
1
1
1
1
1
1
1
1
1
1
1
1
1
1
1
1
1
1
1
1
1
1
1
1
1
1
1
1
1
1
1
1
1
1
1
1
1
1
1
1
1
1
1
1
1
1
1
1
1
1
1
1
1
1
1
1
1
1
1
1
1
1
1
1
1
1
1
1
1
1
1
1
1
1
1
1
1
1
1
1
1
1
1
1
1
1
1
1
1
1
1
1
1
1
1
1
1
1
1
1
1
1
1
1
1
1
1
1
1
1
1
1
1
1
1
1
1
1
1
1
1
1
1
1
1
1
1
1
1
1
1
1
1
1
1
1
1
1
1
1
1
1
1
1
1
1
1
1
1
1
1
1
1
1
1
1
1
1
1
1
1
1
1
1
1
1
1
1
1
1
1
1
1
1
1
1
1
1
1
1
1
1
1
1
1
1
1
1
1
1
1
1
1
1
1
1
1
1
1
1
1
1
1
1
1
1
1
1
1
1
1
1
1
1
1
1
1
1
1
1
1
1
1
1
1
1
1
1
1
1
1
1
1
1
1
1
1
1
1
1
1
1
1
1
1
1
1
1
1
1
1
1
1
1
1
1
1
1
1
1
1
1
1
1
1
1
1
1
1
1
1
1
1
1
1
1
1
1
1
1
1
1
1
1
1
1
1
1
1
1
1
1
1
1
1
1
1
1
1
1
1
1
1
1
1
1
1
1
1
1
1
1
1
1
1
1
1
1
1
1
1
1
1
1
1
1
1
1
1
1
1
1
1
1
1
1
1
1
1
1
1
1
1
1
1
1
1
1
1
1
1
1
1
1
1
1
1
1
1
1
1
1
1
1
1
1
1
1
1
1
1
1
1
1
1
1
1
1
1
1
1
1
1
1
1
1
1
1
1
1
1
1
1
1
1
1
1
1
1
1
1
1
1
1
1
1
1
1
1
1
1
1
1
1
1
1
1
1
1
1
1
1
1
1
1
1
1
1
1
1
1
1
1
1
1
1
1
1
1
1
1
1
1
1
1
1
1
1
1
1
1
1
1
1
1
1
1
1
1
1
1
1
1
1
1
1
1
1
1
1
1
1
1
1
1
1
1
1
1
1
1
1
1
1
1
1
1
1
1
1
1
1
1
1
1
1
1
1
1
1
1
1
1
1
1
1
1
1
1
1
1
1
1
1
1
1
1
1
1
1
1
1
1
1
1
1
1
1
1
1
1
1
1
1
1
1
1
1
1
1
1
1
1
1
1
1
1
1
1
1
1
1
1
1
1
1
1
1
1
1
1
1
1
1
1
1
1
1
1
1
1
1
1
1
1
1
1
1
1
1
1
1
1
1
1
1
1
1
1
1
1
1
1
1
1
1
1
1
1
1
1
1
1
1
1
1
1
1
1
1
1
1
1
1
1
1
1
1
1
1
1
1
1
1
1
1
1
1
1
1
1
1
1
1
1
1
1
1
1
1
1
1
1
1
1
1
1
1
1
1
1
1
1
1
1
1
1
1
1
1
1
1
1
1
1
1
1
1
1
1
1
1
1
1
1
1
1
1
1
1
1
1
1
1
1
1
1
1
1
1
1
1
1
1
1
1
1
1
1
1
1
1
1
1
1
1
1
1
1
1
1
1
1
1
1
1
1
1
1
1
1
1
1
1
1
1
1
1
1
1
1
1
1
1
1
1
1
1
1
1
1
1
1
1
1
1
1
1
1
1
1
1
1
1
1
1
1
1
1
1
1
1
1
1
1
1
1
1
1
1
1
1
1
1
1
1
1
1
1
1
1
1
1
1
1
1
1
1
1
1
1
1
1
1
1
1
1
1
1
1
1
1
1
1
1
1
1
1
1
1
1
1
1
1
1
1
1
1
1
1
1
1
1
1
1
1
1
1
1
1
1
1
1
1
1
1
1
1
1
1
1
1
1
1
1
1
1
1
1
1
1
1
1
1
1
1
1
1
1
1
1
1
1
1
1
1
1
1
1
1
1
1
1
1
1
1
1
1
1
1
1
1
1
1
1
1
1
1
1
1
1
1
1
1
1
1
1
1
1
1
1
1
1
1
1
1
1
1
1
1
1
1
1
1
1
1
1
1
1
1
1
1
1
1
1
1
1
1
1
1
1
1
1
1
1
1
1
1
1
1
1
1
1
1
1
1
1
1
1
1
1
1
1
1
1
1
1
1
1
1
1
1
1
1
1
1
1
1
1
1
1
1
1
1
1
1
1
1
1
1
1
1
1
1
1
1
1
1
1
1
1
1
1
1
1
1
1
1
1
1
1
1
1
1
1
1
1
1
1
1
1
1
1
1
1
1
1
1
1
1
1
1
1
1
1
1
1
1
1
1
1
1
1
1
1
1
1
1
1
1
Publication Years
1
697
2958
378
6
1
Category
1966
216
161
160
104
100
16
3
3
Toolboxes
553
274
168
157
144
118
108
102
68
63
52
50
48
46
38
36
31
25
15
13
10
8
7
1

(August 28 – October 10, 2017)
A nutrition and mortality assessment using SMART methodology was applied and the survey covered 15 statistical (14 districts plus 1) domains countrywide. The main objective of the survey was to assess the current nutrition status of the population, especially ch ... ildren 6-59 months old and women of reproductive age (15-49 years of age). The survey also looked at the major contextual factors contributing to undernutrition such as infant and young child feeding (IYCF) practices; food security indicators; water, sanitation and hygiene indicators; and health situation in Sierra Leone more
A nutrition and mortality assessment using SMART methodology was applied and the survey covered 15 statistical (14 districts plus 1) domains countrywide. The main objective of the survey was to assess the current nutrition status of the population, especially ch ... ildren 6-59 months old and women of reproductive age (15-49 years of age). The survey also looked at the major contextual factors contributing to undernutrition such as infant and young child feeding (IYCF) practices; food security indicators; water, sanitation and hygiene indicators; and health situation in Sierra Leone more

Measuring the Success of Family Planning Initiatives in Rwanda: A Multivariate Decomposition Analysis.
uhoza, Dieudonné Ndaruhuye, Pierre Claver Rutayisire, and Aline Umubyeyi.
Calverton, Maryland, USA: ICF International
(2013)
C2
DHS Working Papers No. 94 - This study described the family planning initiatives in Rwanda and analyzed the 2005 and 2010 RDHS data to identify factors that contribute to the increase in contraceptive use. The Blinder-Oaxaca technique was used to decompose the contributions of women’s characterist
...
ics and their effects.
more
Final report 2016
The National Institute of statistics of Rwanda (NISR) in collaboration with the worldwide Demographic and Health Surveys Program implemented the 2014-15 Rwanda Demographic and Health Survey (RDHS) to collect data for monitoring progress on health programs and policies in Rwanda. This publication ill
...
ustrates the profile of Kigali City
more

The National Institute of statistics of Rwanda (NISR) in collaboration with the worldwide Demographic and Health Surveys Program implemented the 2014-15 Rwanda Demographic and Health Survey (RDHS) to collect data for monitoring progress on health programs and policies in Rwanda. This publication ill
...
ustrates the profile of Eastern Province.
more

he National Institute of statistics of Rwanda (NISR) in collaboration with the worldwide Demographic and Health Surveys Program implemented the 2014-15 Rwanda Demographic and Health Survey (RDHS) to collect data for monitoring progress on health programs and policies in Rwanda. This publication illu
...
strates the profile of Northern Province.
more

The National Institute of statistics of Rwanda (NISR) in collaboration with the worldwide Demographic and Health Surveys Program implemented the 2014-15 Rwanda Demographic and Health Survey (RDHS) to collect data for monitoring progress on health programs and policies in Rwanda. This publication ill
...
ustrates the profile of Southern province
more
The report presents the latest data on more than 50 health-related Sustainable Development Goal and "triple billion" target indicators. The 2021 edition includes preliminary estimates for global excess deaths attributable to COVID-19 for 2020 and the state of global and regional health trends from 2
...
000-2019. It also focuses on persistent health inequalities and data gaps that have been accentuated by the pandemic, with a call to urgently invest in health information systems to ensure the world is better prepared with better data.
more
In 2015, the National Institute of Statistics of Rwanda published the Rwanda Poverty Profile Report 2013/2014,which provided a detailed portrait of the extent and nature of poverty in the country, based on information collected by an integrated household living conditions survey (EICV4) undertaken b
...
etween October 2013 and September 2014.
This report complements the study by looking at the trends in poverty between 2010/11 and 2013/14.It is essential to examine changes in poverty over time, because one of the most important goals of economic Sustainable Development Goals is to eliminate severe poverty by 2030.
more

The Demographic Dividend study on Rwanda assessed the socio-economic and human development potential of our country in the short, medium and long-term period using a comprehensive approach. It generated relevant policy and programme information to guide a well-informed polciy required to propel Rwan
...
da towards achieving its aspirations of being high middle income country by 2035 and high income country by 2050.
The primary objectives of this study were to assess Rwanda’s prospects for harnessing the demographic dividend and demonstrate priority policy and programme options that the country should adopt in order to optimise its chances of earning a maximum demographic dividend in the context of its youthful population and medium, long-term socio-economic development aspirations.
more
This third edition of the National Gender Statistics Report provides the updated sex-disaggregated data in twelve fields: Population and Youth; Education; Health and Nutrition; Economic Activity and time use; Poverty & Social Protection; Justice & Human rights; Environment and Natural Resources; Dec
...
isionmaking and Public life; Infrastructure, ICT and Media; Trade and Business and Industry; Agriculture, Livestock and Forestry, and lastly the Income and Access to Finance. It should be noted that this report takes into account almost all quantitative indicators of the United Nations Minimum Set of Gender Indicators (UNMSGI) as developed by the United Nations Statistical Division (UNSD) and some of the approved quantitative SDGs gender related indicators.
more
This guide presents new knowledge and guidelines on the provision of care to persons living with HIV/AIDS, in accordance with the last guidelines of the World Health Organization (WHO) published in 2006 and adapted to the Rwandan national context. It thus responds to the need by the Ministry of Heal
...
th to improve the skills of the actors in the health sector as well as the quality of care and antiretroviral treatment offered in both public and private health facilities countrywide.
more
The goal of this Global Action Plan is to articulate synergistic actions that will be required to prevent HIVDR from undermining efforts to achieve global targets on health and HIV, and to provide the most effective treatment to all people living with HIV including adults, key populations, pregnant
...
and breastfeeding women, children and adolescents. The Global Action Plan has five strategic objectives: 1) prevention and response; 2) monitoring and surveillance; 3) research and innovation; 4) laboratory capacity; and 5) governance and enabling mechanisms.
more
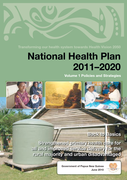
The health of the people and health services are in crisis, and together as partners this plan commits us to strategies aimed at achieving our goal of:
Strengthened primary health care for all, and improved service delivery for the rural majority and the urban disadvantaged.
Original fi ... le: 67 MB more
Strengthened primary health care for all, and improved service delivery for the rural majority and the urban disadvantaged.
Original fi ... le: 67 MB more
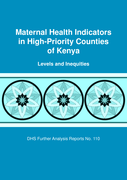
Levels and Inequities
DHS Further Analysis Reports No. 110
This study shows large variations in maternal health indicators across high-priority counties in Kenya. Nairobi exceeds the national average on all maternal health indicators in this study, while other highpriority counties consist ... ently are disadvantaged compared with Kenya as a whole in most maternal health indicators. Kisumu exceeds the national average in use of antenatal care, delivery in a health facility, and postnatal care, but not other indicators. Nakuru has fewer women with fertility risk and fewer women who report that the distance they must travel to reach a health facility is a problem.
This study identifies a number of inequities in maternal health indicators across socio-demographic characteristics in the high-priority counties—most in the distribution of delivery care and least in antenatal care. Inequities are also observed in fertility risk and postnatal care. more
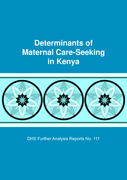
DHS Further Analysis Reports No. 111
This study is a theory-driven analysis of the socio-demographic determinants of maternal care seeking in Kenya. Specifically, it examines predisposing, enabling, and need factors potentially associated with use of antenatal care (ANC), health facility delive ... ry, and timely postnatal care (PNC).
This study uses data from the 2014 Kenya Demographic and Health Survey (KDHS) conducted among women age 15-49 with a live birth in the five years preceding the survey. It includes data from all 47 counties of Kenya, grouped contiguously into 12 regions. We apply Andersen’s Behavioral Model of Health Services Use to examine socio-demographic predictors of health service use. We estimate logistic regression models for adequate use of ANC (defined as attending at least four ANC visits, starting in the first three months of pregnancy), delivery in a health facility, and PNC within 48 hours of delivery. more
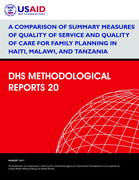
DHS Methodological Report No. 20
This study used Service Provision Assessment (SPA) and Demographic and Health Survey (DHS) data from Haiti, Malawi, and Tanzania to compare traditionally used additive methods with a data reduction method—principal component analysis (PCA).
We scored ... the quality of health facilities with three approaches (simple additive, weighted additive, and PCA) for two constructs: quality of services, with only facilities-level data, and quality of care, which incorporates observation and client data. We ranked facilities as high, medium, or low quality based on their scores. Our results indicated that the rankings change with the scoring methodology. There was more consistency in the rankings of facilities by the simple additive and PCA methods than the weighted additive and PCA-based rankings. This may be due to the low factor loadings and little variance explained by the first component in the PCA. We aggregated facility scores to their respective DHS clusters (Haiti, Malawi) or regions (Tanzania) and geographically linked them to women interviewed in DHS surveys to test associations between the use of family planning services and the quality environment, as measured with each index. more

Replacement of Annex 2 of WHO Technical Report Series, No. 964
...
more
more