Filter
2389
Text search:
demographic
indicators
Featured
118
900
Language
2328
47
34
19
14
12
6
5
4
2
2
1
1
1
1
1
1
1
1
1
1
1
1
1
1
1
1
Document type
1675
393
120
70
66
19
18
12
8
4
2
1
Countries
129
113
108
98
90
80
79
75
74
73
67
61
57
56
55
50
42
40
36
35
35
33
31
30
30
28
23
21
19
17
16
15
15
15
14
13
13
12
11
10
10
9
9
9
9
9
9
7
7
7
6
6
6
6
6
6
6
5
5
5
5
5
4
4
4
4
4
4
3
3
3
3
3
3
3
3
3
3
2
2
2
2
2
2
2
2
2
2
2
1
1
1
1
1
1
1
1
1
1
1
1
1
1
1
1
1
1
1
1
1
1
1
1
1
1
1
1
1
1
Authors & Publishers
173
87
79
76
61
55
51
50
42
32
26
24
20
20
18
17
16
16
15
13
12
12
10
10
10
10
9
9
9
9
8
8
8
8
8
7
7
7
7
7
7
7
7
6
6
6
6
6
6
6
6
6
6
6
6
6
6
6
6
6
5
5
5
5
5
5
5
5
5
5
5
5
5
5
5
5
5
4
4
4
4
4
4
4
4
4
4
4
4
4
4
4
4
4
4
4
4
4
4
4
4
3
3
3
3
3
3
3
3
3
3
3
3
3
3
3
3
3
3
3
3
3
3
3
3
3
3
3
3
3
3
3
3
3
3
3
3
3
3
3
3
3
3
3
3
3
3
3
3
3
3
3
3
3
3
3
3
3
3
3
3
3
3
2
2
2
2
2
2
2
2
2
2
2
2
2
2
2
2
2
2
2
2
2
2
2
2
2
2
2
2
2
2
2
2
2
2
2
2
2
2
2
2
2
2
2
2
2
2
2
2
2
2
2
2
2
2
2
2
2
2
2
2
2
2
2
2
2
2
2
2
2
2
2
2
2
2
2
2
2
2
2
2
2
2
2
2
2
2
2
2
2
2
2
2
2
2
2
2
2
2
2
2
2
2
2
2
2
2
2
2
2
2
2
2
2
2
2
2
2
2
2
2
2
2
2
2
2
2
2
2
2
2
2
2
2
2
2
2
2
2
2
2
2
2
2
2
2
2
2
2
2
2
2
2
2
2
2
2
2
2
2
2
2
2
2
2
2
2
2
2
2
2
2
2
2
2
2
2
1
1
1
1
1
1
1
1
1
1
1
1
1
1
1
1
1
1
1
1
1
1
1
1
1
1
1
1
1
1
1
1
1
1
1
1
1
1
1
1
1
1
1
1
1
1
1
1
1
1
1
1
1
1
1
1
1
1
1
1
1
1
1
1
1
1
1
1
1
1
1
1
1
1
1
1
1
1
1
1
1
1
1
1
1
1
1
1
1
1
1
1
1
1
1
1
1
1
1
1
1
1
1
1
1
1
1
1
1
1
1
1
1
1
1
1
1
1
1
1
1
1
1
1
1
1
1
1
1
1
1
1
1
1
1
1
1
1
1
1
1
1
1
1
1
1
1
1
1
1
1
1
1
1
1
1
1
1
1
1
1
1
1
1
1
1
1
1
1
1
1
1
1
1
1
1
1
1
1
1
1
1
1
1
1
1
1
1
1
1
1
1
1
1
1
1
1
1
1
1
1
1
1
1
1
1
1
1
1
1
1
1
1
1
1
1
1
1
1
1
1
1
1
1
1
1
1
1
1
1
1
1
1
1
1
1
1
1
1
1
1
1
1
1
1
1
1
1
1
1
1
1
1
1
1
1
1
1
1
1
1
1
1
1
1
1
1
1
1
1
1
1
1
1
1
1
1
1
1
1
1
1
1
1
1
1
1
1
1
1
1
1
1
1
1
1
1
1
1
1
1
1
1
1
1
1
1
1
1
1
1
1
1
1
1
1
1
1
1
1
1
1
1
1
1
1
1
1
1
1
1
1
1
1
1
1
1
1
1
1
1
1
1
1
1
1
1
1
1
1
1
1
1
1
1
1
1
1
1
1
1
1
1
1
1
1
1
1
1
1
1
1
1
1
1
1
1
1
1
1
1
1
1
1
1
1
1
1
1
1
1
1
1
1
1
1
1
1
1
1
1
1
1
1
1
1
1
1
1
1
1
1
1
1
1
1
1
1
1
1
1
1
1
1
1
1
1
1
1
1
1
1
1
1
1
1
1
1
1
1
1
1
1
1
1
1
1
1
1
1
1
1
1
1
1
1
1
1
1
1
1
1
1
1
1
1
1
1
1
1
1
1
1
1
1
1
1
1
1
1
1
1
1
1
1
1
1
1
1
1
1
1
1
1
1
1
1
1
1
1
1
1
1
1
1
1
1
1
1
1
1
1
1
1
1
1
1
1
1
1
1
1
1
1
1
1
1
1
1
1
1
1
1
1
1
1
1
1
1
1
1
1
1
1
1
1
1
1
1
1
1
1
1
1
1
1
1
1
1
1
1
1
1
1
1
1
1
1
1
1
1
1
1
1
1
1
1
1
1
1
1
1
1
1
1
1
1
1
1
1
1
1
1
1
1
1
1
1
1
1
1
1
1
1
1
1
1
1
1
1
1
1
1
1
1
1
1
1
1
1
1
1
1
1
1
1
1
1
1
1
1
1
1
1
1
1
1
1
1
1
1
1
1
1
1
1
1
1
1
1
1
1
1
1
1
1
1
1
1
1
1
1
1
1
1
1
1
1
1
1
1
1
1
1
1
1
1
1
1
1
1
1
1
1
1
1
1
1
1
1
1
1
1
1
1
1
1
1
1
1
1
1
1
1
1
1
1
1
1
1
1
1
1
1
1
1
1
1
1
1
1
1
1
1
1
1
1
1
1
1
1
1
1
1
1
1
1
1
1
1
1
1
1
1
1
1
1
1
1
1
1
1
1
1
1
1
1
1
1
1
1
1
1
1
1
1
1
1
1
1
1
1
1
1
1
1
1
1
1
1
1
1
1
1
1
1
1
1
1
1
1
1
1
1
1
1
1
1
1
1
1
1
1
1
1
1
1
1
1
1
1
1
1
1
1
1
1
1
1
1
1
1
1
1
1
1
1
1
1
1
1
1
1
1
1
1
1
1
1
1
1
1
1
1
1
1
1
1
1
1
1
1
1
1
1
1
1
1
1
1
1
1
1
1
1
1
1
1
1
1
1
1
1
1
1
1
1
1
1
1
1
1
1
1
1
1
1
1
1
1
1
1
1
1
1
1
1
1
1
1
1
1
1
1
1
1
1
1
1
1
1
1
1
1
1
1
1
1
1
1
1
1
1
1
1
1
1
1
1
1
1
1
1
1
1
1
1
1
1
1
1
1
1
1
1
1
1
1
1
1
1
1
1
1
1
1
1
1
1
1
1
1
1
1
1
1
1
1
1
1
1
1
1
1
1
1
1
1
1
1
1
1
1
1
1
1
1
1
1
1
1
1
1
1
1
1
1
1
1
1
1
1
1
1
1
1
1
1
1
1
1
1
1
1
1
1
1
1
1
1
1
1
1
1
1
1
1
1
1
1
1
1
1
1
1
1
1
1
1
1
1
1
1
1
1
1
1
1
1
1
1
1
1
1
1
1
1
1
1
1
1
1
1
1
1
1
1
1
1
1
1
1
1
1
1
1
1
1
1
1
1
1
1
1
1
1
1
1
1
1
1
1
1
1
1
1
1
1
1
1
1
1
1
1
1
1
1
1
1
1
1
1
1
1
1
1
1
1
1
1
1
1
1
1
1
1
1
1
1
1
1
1
1
1
1
1
1
1
1
1
1
1
1
1
1
1
1
1
1
1
1
1
1
1
1
1
1
1
1
1
1
1
1
1
1
1
1
1
1
1
1
1
1
1
1
1
1
1
1
1
1
1
1
1
1
1
1
1
1
1
1
1
1
1
1
1
1
1
1
1
1
1
1
1
1
1
1
1
1
1
1
1
1
1
1
1
1
1
1
1
1
1
1
1
1
1
1
1
1
1
1
1
1
1
1
1
1
1
1
1
1
1
1
1
1
1
1
1
1
1
1
1
1
1
1
1
1
1
1
1
1
1
1
1
1
1
1
1
1
1
1
1
1
1
1
1
1
1
1
1
1
1
1
1
1
1
1
1
1
1
1
1
1
1
1
1
1
1
1
1
1
1
1
1
1
1
1
1
1
1
1
1
1
1
1
1
1
1
1
1
1
1
1
1
1
1
1
1
1
1
1
1
1
1
1
1
1
1
1
1
1
1
1
1
1
1
1
1
1
1
1
1
1
1
1
1
1
1
1
1
1
1
1
1
1
1
1
1
1
1
1
1
1
1
1
1
1
1
1
1
1
1
1
1
1
1
1
1
1
1
1
1
1
1
1
1
1
1
1
1
1
1
1
1
1
1
1
1
1
1
1
1
1
1
1
1
1
1
1
1
1
1
1
1
1
1
1
1
1
1
1
1
1
1
1
1
1
1
1
1
1
1
1
1
1
1
1
1
1
1
1
1
1
1
1
1
1
1
1
1
1
1
1
1
1
1
1
1
1
1
1
1
1
1
1
1
1
1
1
1
1
1
1
1
1
1
1
1
1
1
1
1
1
1
1
1
1
1
1
1
1
1
1
1
1
1
1
1
1
1
1
1
1
1
1
1
1
1
1
1
1
1
1
1
1
1
1
1
1
1
1
1
1
1
1
1
1
1
1
1
1
1
1
1
1
1
1
1
1
1
1
1
1
1
1
1
1
1
1
1
1
1
1
1
1
1
1
1
1
1
1
1
1
1
1
1
1
1
1
1
1
1
1
1
1
1
1
1
1
1
1
1
1
1
1
1
1
1
1
1
1
1
1
1
1
1
1
1
1
1
1
1
1
1
1
1
1
1
1
1
1
1
1
1
1
1
1
1
1
1
1
1
1
1
1
1
1
1
1
1
1
1
1
1
1
1
1
1
1
1
1
1
1
1
1
1
1
1
1
1
1
1
1
1
1
1
1
1
1
1
1
1
1
1
1
1
1
1
1
1
1
1
1
1
1
1
1
1
1
1
1
1
1
1
1
1
1
1
1
1
1
1
1
1
1
1
1
1
1
1
1
1
1
1
1
1
1
1
1
1
1
1
1
1
1
1
1
1
1
1
1
1
1
1
1
1
1
1
1
1
1
1
1
1
1
1
1
1
1
1
1
1
1
1
1
1
1
1
1
1
1
1
1
1
1
1
1
1
1
1
1
1
1
1
1
1
1
1
1
1
1
1
1
1
1
1
1
1
1
1
1
1
1
1
1
1
1
1
1
1
1
1
1
1
1
1
1
1
1
1
1
1
1
1
1
1
1
1
1
1
1
1
1
1
1
1
1
1
1
1
1
1
1
1
1
1
1
1
1
1
1
1
1
Publication Years
423
1759
201
4
1
1
Category
1482
121
116
85
78
17
6
5
Toolboxes
144
98
80
76
71
68
42
41
36
30
27
27
26
24
20
17
12
11
10
7
2
2
1
Multidimensional Child Deprivation Trend Analysis in Ethiopia
Plavgo, Ilze, Martha Kibur, Mahider Bitew, Tesfayi Gebreselassie, Yumi Matsuda, and Roger Pearson
ICF International
(2013)
C1
Further Analysis of the 2000, 2005, and 2011 Demographic and Health Surveys. DHS Further Analysis Reports No. 83
Further Analysis of the 2000, 2005, and 2011 Demographic Health Surveys. DHS Further Analysis Reports No. 72

DHS Further Analysis Reports No. 111
This study is a theory-driven analysis of the socio-demographic determinants of maternal care seeking in Kenya. Specifically, it examines predisposing, enabling, and need factors potentially associated with ... use of antenatal care (ANC), health facility delivery, and timely postnatal care (PNC).
This study uses data from the 2014 Kenya Demographic and Health Survey (KDHS) conducted among women age 15-49 with a live birth in the five years preceding the survey. It includes data from all 47 counties of Kenya, grouped contiguously into 12 regions. We apply Andersen’s Behavioral Model of Health Services Use to examine socio-demographic predictors of health service use. We estimate logistic regression models for adequate use of ANC (defined as attending at least four ANC visits, starting in the first three months of pregnancy), delivery in a health facility, and PNC within 48 hours of delivery. more
Version-1, June 2018
This document provides 3MDG stakeholders with essential information on SRHR indicators, derived from the 3MDG Logical Framework, Data Dictionary for Health Service Indicators ... (2014 June, DoPH, MoHA), A Guide to Monitoring and Evaluating Adolescent Reproductive Health Programs (MEASURE Evaluation, June 2000) and Monitoring National Cervical Cancer Prevention and Control Programmes (WHO, PAHO, 2013). Partners are strongly encouraged to integrate the SRHR indicators into their ongoing monitoring and evaluation (M&E) activities.
These indicators are designed to help partners assess the current state of their activities, their progress towards achieving their targets, and contribution towards the national response. This guideline is designed to improve the quality and consistency of data collected at the township level, which will enhance the accuracy of conclusions drawn when the data are aggregated. more

Global AIDS Monitoring 2019
UNAIDS (Joint United Nations Programme on HIVAIDS)
(2018)
C2
UNAIDS 2018, Guidance
Indicators for monitoring the
2016 Political Declaration on Ending AIDS
Thefirst report on Latin America and the Carribean presents key indicators on health and health systems in 33 Latin America and the Caribbean countries. . Analysis is based on the latest comparable data across almost 100
...
indicators including equity, health status, determinants of health, health care resources and utilisation, health expenditure and financing, and quality of care. The editorial discusses the main challenges for the region brought by the COVID-19 pandemic, such as managing the outbreak as well as mobilising adequate resources and using them efficiently to ensure an effective response to the epidemic.
more
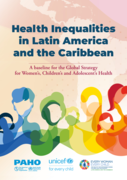
his publication provides an overview of social inequalities in several indicators related to the health of women, children, and adolescents in a region deemed as one with high levels of inequality: Latin America and the Caribbean (LAC). In order for
...
it to serve as a baseline for the 2030 Agenda, emphasis is placed on examining these inequalities around the year 2014. The analysis suggests that reducing within-country disparities is a priority, as widespread social inequalities in health are identified among LAC countries.
more
We combine data on Chinese development projects with data from Demographic and Health Surveys to study the impact of Chinese aid on household welfare in sub-Saharan Africa. We use a novel methodology to test the effect of Chinese aid on three import
...
ant development outcomes: education, health, and nutrition. For each outcome, we use difference-in-difference estimations to compare household areas near Chinese project sites to control areas located farther away, before and after receiving Chinese aid. This empirical strategy rules out many confounding factors that can bias measuring the impact of Chinese aid on our outcome variables. First, we find that Chinese projects significantly improve education and child mortality in treatment areas, but do not significantly affect nutrition. Second, social sector projects have a larger effect on outcomes than economic projects. Third, we do not find significant effects for projects that ended more than five years before the post-treatment survey wave. Our results are robust to a host of robustness checks.
more
Further Analysis of the 2000, 2005, 2010, and 2014 Cambodia Demographic and Health Surveys | DHS Further Analysis Reports No. 106
The 2013 RMIS is a nationally representative, household-based survey that provides data on malaria indicators, which are used to assess the progress of a malaria control program. The primary objective of the 2013 Rwanda Malaria Indicator Survey (201
...
3 RMIS) was to provide up-to date information on the prevention of malaria to policymakers, planners, and researchers.
more
DHS Methodological Report No. 20
This study used Service Provision Assessment (SPA) and Demographic and Health Survey (DHS) data from Haiti, Malawi, and Tanzania to compare traditionally used additive methods with a data reduction method— ... principal component analysis (PCA).
We scored the quality of health facilities with three approaches (simple additive, weighted additive, and PCA) for two constructs: quality of services, with only facilities-level data, and quality of care, which incorporates observation and client data. We ranked facilities as high, medium, or low quality based on their scores. Our results indicated that the rankings change with the scoring methodology. There was more consistency in the rankings of facilities by the simple additive and PCA methods than the weighted additive and PCA-based rankings. This may be due to the low factor loadings and little variance explained by the first component in the PCA. We aggregated facility scores to their respective DHS clusters (Haiti, Malawi) or regions (Tanzania) and geographically linked them to women interviewed in DHS surveys to test associations between the use of family planning services and the quality environment, as measured with each index. more
Census Report Volume 4-C
The 2014 Myanmar Census provided the opportunity to measure maternal mortality. The questions on deaths in households during the twelve months prior to the Census were included in the questionnaire, as well as questions necessary to estimate maternal mortality ... indicators. more
The 2014 Myanmar Census provided the opportunity to measure maternal mortality. The questions on deaths in households during the twelve months prior to the Census were included in the questionnaire, as well as questions necessary to estimate maternal mortality ... indicators. more
Version 2, January 2016
The primary purpose of this document is to provide 3MDG stakeholders with some essential information on the MNCH core-indicators for 3MDG, which were derived from the 3MDG Logical Framework, Data Dictionary for Health S ... ervice Indicators (2014 June, DoPH, MoH), A Guide for Monitoring and Evaluating Child Health Programmes (MEASURE Evaluation, September 2005) and Monitoring Emergency Obstetric Care (WHO/UNICEF/UNFPA/AMDD). Partners are strongly encouraged to integrate the MNCH indicators into their ongoing monitoring and evaluation (M&E) activities.
These indicators are designed to help Partners assess the current state of their activities, their progress towards achieving their targets, and contribution towards the national response. This guideline is designed to improve the quality and consistency of data collected at the township level, which will enhance the accuracy of conclusions drawn when the data are aggregated. more
Accessed on 03.03.2020
The country recognizes the importance of family planning as they focus on achieving a demographic dividend. In order to improve the service delivery and supply chain, Senegal is strengthening its data management and reporting
...
. Domestic resource mobilization for family planning remains a key challenges for Senegal.
more
This document aims to describe a minimum set of surveillance activities recommended at the national level to detect and monitor the relative prevalence of SARS-CoV-2 variants and outline a set of activities for the characterization and assessment of risk posed by these variants. A set of
...
indicators is also provided to standardize monitoring and public reporting of variant circulation.
The document is primarily intended for national and sub-national public health authorities and partners who support implementation of surveillance for SARS-CoV-2 variants
more
The World health statistics report is the annual compilation of health and health-related indicators which has been published by the World Health Organization (WHO) since 2005. The 2023 edition reviews more than 50 health-related
...
indicators from the Sustainable Development Goals (SDGs) and WHO’s Thirteenth General Programme of Work (GPW 13).
more
Census Report Volume 4-E
As no census has been undertaken in over 30 years, many aspects of the demographic situation in the country were unknown. For instance, before the Census it was thought that the country had a population of about 60 mill ... ion, but the 2014 Census showed that the population (including an estimate for under-enumeration) was 51,486,253 persons, around 8.5 million less than the previous estimate.
In the 1983 census, 35,307,913 persons were recorded. Therefore between 1983 and 2014, the population increased by 46 per cent. With an average annual population growth rate of 0.89 per cent between 2003 and 2014, Myanmar is one of the slowest growing countries in Southeast Asia. more
Measuring progress towards universal health coverage.
This sixth edition of Health at a Glance Asia/Pacific presents a set of key indicators of health status, the determinants of health, health care resources and utilisation, health care expenditur
...
e and financing and quality of care across 27 Asia-Pacific countries and territories. It also provides a series of dashboards to compare performance across countries and territories, and a thematic analysis on the impact of the COVID-19 outbreak on Asia/Pacific health systems.
more
The report presents the latest data on more than 50 health-related Sustainable Development Goal and "triple billion" target indicators. The 2021 edition includes preliminary estimates for global excess deaths attributable to COVID-19 for 2020 and th
...
e state of global and regional health trends from 2000-2019. It also focuses on persistent health inequalities and data gaps that have been accentuated by the pandemic, with a call to urgently invest in health information systems to ensure the world is better prepared with better data.
more
2018 monitoring report: current status and strategic priorities
The report sets out the status of women’s, children’s and adolescents’ health, and on health systems and social and environmental determinants. Regional dashboards on 16 key indicat ... ors highlight where progress is being made or lagging. There is progress overall, but not at the level required to achieve the 2030 goals. There are some areas where progress has stalled or is reversing, namely neonatal mortality, gender inequalities and health in humanitarian settings. more
The report sets out the status of women’s, children’s and adolescents’ health, and on health systems and social and environmental determinants. Regional dashboards on 16 key indicat ... ors highlight where progress is being made or lagging. There is progress overall, but not at the level required to achieve the 2030 goals. There are some areas where progress has stalled or is reversing, namely neonatal mortality, gender inequalities and health in humanitarian settings. more