Filter
3249
Text search:
maps
Featured
353
806
Language
3172
86
71
47
31
31
22
8
5
5
3
3
3
3
3
3
2
2
2
2
2
2
2
2
2
2
1
1
1
1
1
1
1
1
1
1
1
1
1
1
1
1
1
1
1
1
1
1
Document type
1581
686
426
227
139
79
37
26
16
12
10
3
2
Countries
180
85
62
60
57
55
53
51
50
48
47
46
44
41
36
36
34
29
28
27
26
25
25
24
24
24
21
21
20
20
19
18
17
16
15
15
15
13
13
12
12
11
11
11
10
10
9
9
8
8
8
7
7
7
7
6
6
6
6
6
6
6
5
5
5
5
5
4
4
4
4
4
4
4
4
3
3
3
3
3
3
3
3
3
3
3
3
3
3
3
3
3
2
2
2
2
2
2
2
2
2
2
2
2
2
2
2
2
2
2
2
2
2
2
1
1
1
1
1
1
1
1
1
1
1
1
1
1
1
1
1
1
1
1
1
1
1
Authors & Publishers
877
401
210
163
112
110
63
49
36
33
28
21
21
15
15
14
14
12
12
12
12
12
11
11
10
9
9
9
9
8
8
8
8
8
8
8
8
8
8
7
7
7
7
7
7
6
6
6
6
5
5
5
5
5
5
5
5
5
5
5
5
5
4
4
4
4
4
4
4
4
4
4
4
4
4
4
4
4
4
4
4
4
4
4
4
4
4
4
4
4
4
4
4
4
3
3
3
3
3
3
3
3
3
3
3
3
3
3
3
3
3
3
3
3
3
3
3
3
3
3
3
3
3
3
3
3
3
3
3
3
3
3
3
3
3
3
3
3
3
3
3
2
2
2
2
2
2
2
2
2
2
2
2
2
2
2
2
2
2
2
2
2
2
2
2
2
2
2
2
2
2
2
2
2
2
2
2
2
2
2
2
2
2
2
2
2
2
2
2
2
2
2
2
2
2
2
2
2
2
2
2
2
2
2
2
2
2
2
2
2
2
2
2
2
2
2
2
2
2
2
2
2
2
2
2
2
2
2
2
2
2
2
2
2
2
2
2
2
2
2
2
2
2
2
2
2
2
2
2
2
2
2
2
2
2
2
2
2
2
2
2
2
2
2
2
2
2
2
2
2
2
2
2
2
2
2
2
2
1
1
1
1
1
1
1
1
1
1
1
1
1
1
1
1
1
1
1
1
1
1
1
1
1
1
1
1
1
1
1
1
1
1
1
1
1
1
1
1
1
1
1
1
1
1
1
1
1
1
1
1
1
1
1
1
1
1
1
1
1
1
1
1
1
1
1
1
1
1
1
1
1
1
1
1
1
1
1
1
1
1
1
1
1
1
1
1
1
1
1
1
1
1
1
1
1
1
1
1
1
1
1
1
1
1
1
1
1
1
1
1
1
1
1
1
1
1
1
1
1
1
1
1
1
1
1
1
1
1
1
1
1
1
1
1
1
1
1
1
1
1
1
1
1
1
1
1
1
1
1
1
1
1
1
1
1
1
1
1
1
1
1
1
1
1
1
1
1
1
1
1
1
1
1
1
1
1
1
1
1
1
1
1
1
1
1
1
1
1
1
1
1
1
1
1
1
1
1
1
1
1
1
1
1
1
1
1
1
1
1
1
1
1
1
1
1
1
1
1
1
1
1
1
1
1
1
1
1
1
1
1
1
1
1
1
1
1
1
1
1
1
1
1
1
1
1
1
1
1
1
1
1
1
1
1
1
1
1
1
1
1
1
1
1
1
1
1
1
1
1
1
1
1
1
1
1
1
1
1
1
1
1
1
1
1
1
1
1
1
1
1
1
1
1
1
1
1
1
1
1
1
1
1
1
1
1
1
1
1
1
1
1
1
1
1
1
1
1
1
1
1
1
1
1
1
1
1
1
1
1
1
1
1
1
1
1
1
1
1
1
1
1
1
1
1
1
1
1
1
1
1
1
1
1
1
1
1
1
1
1
1
1
1
1
1
1
1
1
1
1
1
1
1
1
1
1
1
1
1
1
1
1
1
1
1
1
1
1
1
1
1
1
1
1
1
1
1
1
1
1
1
1
1
1
1
1
1
1
1
1
1
1
1
1
1
1
1
1
1
1
1
1
1
1
1
1
1
1
1
1
1
1
1
1
1
1
1
1
1
1
1
1
1
1
1
1
1
1
1
1
1
1
1
1
1
1
1
1
1
1
1
1
1
1
1
1
1
1
1
1
1
1
1
1
1
1
1
1
1
1
1
1
1
1
1
1
1
1
1
1
1
1
1
1
1
1
1
1
1
1
1
1
1
1
1
1
1
1
1
1
1
1
1
1
1
1
1
1
1
1
1
1
1
1
1
1
1
1
1
1
1
1
1
1
1
1
1
1
1
1
1
1
1
1
1
1
1
1
1
1
1
1
1
1
1
1
1
1
1
1
1
1
1
1
1
1
1
1
1
1
1
1
1
1
1
1
1
1
1
1
1
1
1
1
1
1
1
1
1
1
1
1
1
1
1
1
1
1
1
1
1
1
1
1
1
1
1
1
1
1
1
1
1
1
1
1
1
1
1
1
1
1
1
1
1
1
1
1
1
1
1
1
1
1
1
1
1
1
1
1
1
1
1
1
1
1
1
1
1
1
1
1
1
1
1
1
1
1
1
1
1
1
1
1
1
1
1
1
1
1
1
1
1
1
1
1
1
1
1
1
1
1
1
1
1
1
1
1
1
1
1
1
1
1
1
1
1
1
1
1
1
1
1
1
1
1
1
1
1
1
1
1
1
1
1
1
1
1
1
1
1
1
1
1
1
1
1
1
1
1
1
1
1
1
1
1
1
1
1
1
1
1
1
1
1
1
1
1
1
1
1
1
1
1
1
1
1
1
1
1
1
1
1
1
1
1
1
1
1
1
1
1
1
1
1
1
1
1
1
1
1
1
1
1
1
1
1
1
1
1
1
1
1
1
1
1
1
1
1
1
1
1
1
1
1
1
1
1
1
1
1
1
1
1
1
1
1
1
1
1
1
1
1
1
1
1
1
1
1
1
1
1
1
1
1
1
1
1
1
1
1
1
1
1
1
1
1
1
1
1
1
1
1
1
1
1
1
1
1
1
1
1
1
1
1
1
1
1
1
1
1
1
1
1
1
1
1
1
1
1
1
1
1
1
1
1
1
1
1
1
1
1
1
1
1
1
1
1
1
1
1
1
1
1
1
1
1
1
1
1
1
1
1
1
1
1
1
1
1
1
1
1
1
1
1
1
1
1
1
1
1
1
1
1
1
1
1
1
1
1
1
1
1
1
1
1
1
1
1
1
1
1
1
1
1
1
1
1
1
1
1
1
1
1
1
1
1
1
1
1
1
1
1
1
1
1
1
1
1
1
1
1
1
1
1
1
1
1
1
1
1
1
1
1
1
1
1
1
1
1
1
1
1
1
1
1
1
1
1
1
1
1
1
1
1
1
1
1
1
1
1
1
1
1
1
1
1
1
1
1
1
1
1
1
1
1
1
1
1
1
1
1
1
1
1
1
1
1
1
1
1
1
1
1
1
1
1
1
1
1
1
1
1
1
1
1
1
1
1
1
1
1
1
1
1
1
1
1
1
1
1
1
1
1
1
1
1
1
1
1
1
1
1
1
1
1
1
1
1
1
1
1
1
1
1
1
1
1
1
1
1
1
1
1
1
1
1
1
1
1
1
1
1
1
1
1
1
1
1
1
1
1
1
1
1
1
1
1
1
1
1
1
1
1
1
1
1
1
1
1
1
1
1
1
1
1
1
1
1
1
1
1
1
1
1
1
1
1
1
1
1
1
1
1
1
1
1
1
1
1
1
1
1
1
1
1
1
1
1
1
1
1
1
1
1
1
1
1
1
1
1
1
1
1
1
1
1
1
1
1
1
1
1
1
1
1
1
1
1
1
1
1
1
1
1
1
1
1
1
1
1
1
1
1
1
1
1
1
1
1
1
1
1
1
1
1
1
1
1
1
1
1
1
1
1
1
1
1
1
1
1
1
1
1
1
1
1
1
1
1
1
1
1
1
1
1
1
1
1
1
1
1
1
1
1
1
1
1
1
1
1
1
1
1
1
1
1
1
1
1
1
1
1
1
1
1
1
1
1
1
1
1
1
1
1
1
1
1
1
1
1
1
1
1
1
1
1
1
1
1
1
1
1
1
1
1
1
1
1
1
1
1
1
1
1
1
1
1
1
1
1
1
1
1
1
1
1
1
1
1
1
1
1
1
1
1
1
1
1
1
1
1
1
1
1
1
1
1
1
1
1
1
1
1
1
1
1
1
1
1
1
1
1
1
1
1
1
1
1
1
1
1
1
1
1
1
1
1
1
1
1
1
1
1
1
1
1
1
1
1
1
1
1
1
1
1
1
1
1
1
1
1
1
1
1
1
1
1
1
1
1
1
1
1
1
1
1
1
1
1
1
1
1
1
1
1
1
1
1
1
1
1
1
1
1
1
1
1
1
1
1
1
1
1
1
1
1
1
1
1
1
1
1
1
1
1
1
1
1
1
1
1
1
1
1
1
1
1
1
1
1
1
1
1
1
1
1
1
1
1
1
1
1
1
1
1
1
1
1
1
1
1
1
1
1
1
1
1
1
1
1
1
1
1
1
1
1
1
1
1
1
1
1
1
1
1
1
1
1
1
1
1
1
1
1
1
1
1
1
1
1
1
1
1
1
1
1
1
1
1
1
1
1
1
1
1
1
1
1
1
1
1
1
1
1
1
1
1
1
1
1
1
1
1
1
1
1
1
1
1
1
1
1
1
1
1
1
1
1
1
1
1
1
1
1
1
1
1
1
1
1
1
1
1
1
1
1
1
1
1
1
1
1
1
1
1
1
1
1
1
1
1
1
1
1
1
1
1
1
1
1
1
1
1
1
1
1
1
1
1
1
1
1
1
1
1
1
1
1
1
1
1
1
1
1
1
1
1
1
1
1
1
1
1
1
1
1
1
1
1
1
1
1
1
1
1
1
1
1
1
1
1
1
1
1
1
1
1
1
1
1
1
1
1
1
1
Publication Years
1057
1907
274
9
1
1
Category
738
412
290
252
182
91
66
5
1
Toolboxes
225
206
206
197
185
185
146
110
108
107
101
96
82
68
60
54
52
43
32
27
24
23
3
2
2
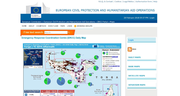
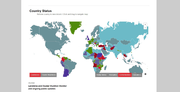
The Emergency Response Coordination Centre (ERCC) Portal of the European Civil Protection and Humanitarian Aid Operations includes Daily Maps, Base maps, Satellite
...
Maps and Situation Maps.
more
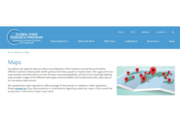
Our global and regional maps provide a visual depiction of the locations around the world where different nutrition-related public health policies have been passed or implemented. The sugary drink tax map includes brief descriptions of over 50 taxes
...
now passed globally, and the front-of-package labeling map provides images of the different label types used worldwide and includes brief policy descriptions for mandatory label policies.
more
Tuberculosis (TB) Maps Dashboard
recommended
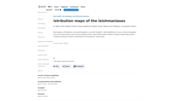
Each year 1–2 million people are diagnosed with a tropical disease called leishmaniasis, which is caused by single-celled parasites. People are infected when they are bitten by sandflies carrying the parasite, and often develop skin lesions around the bite site. Though mild cases may recover on th
...
eir own or with treatment, sometimes the parasites multiply and spread elsewhere causing further skin lesions and facial disfigurement. Furthermore, the parasites can also infect internal organs such as the spleen and the liver, which without treatment can be fatal.
more
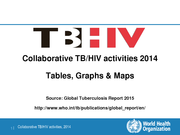
Collaborative TB/HIV activities 2014 Tables, Graphs & Maps
World Health Organization
(2019)
C_WHO
Source: Global Tuberculosis Report 2015
http://www.who.int/tb/publications/global_report/en/
Accessed: 05.10.2019
Landmine and Cluster Munition Monitor: Interactive Maps
International Campaign to Ban Landmines
(2018)
C3
Monitor interactive maps present treaty status, stockpiles, contamination, and casualties data on landmines and cluster munitions, primarily based on the latest Monitor annual reports.

7 Stages
Existing data on chronic obstructive pulmonary disease (COPD) prevalence are irregularly distributed around the world, and in many geographic regions data are scarce or even nonexistent. This fact hinders the implementation of adequate preventive and therapeutic interventions to reduce the high burd
...
en and costs of COPD. In the current study, we have used the Geographic Information System (GIS) inverse distance weighted (IDW) interpolation technique with the objective of visualising spatial data of COPD prevalence in the world and obtaining a visual impression of the magnitude of this global health problem. GIS has been recognised as an effective tool to display the geographical distribution of data, even when they are few and widely separated, as is the case with the prevalence of COPD.
more
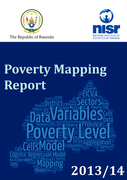
This report complements the previous poverty analysis studies by presenting a series of poverty maps of Rwanda at cell and sector levels, based on data from EICV4 and the 2012 Population and Housing Census. A poverty map is simply a map that shows t
...
he incidence of poverty in different areas of the country. It allows the viewer to appreciate, at a glance, the geographic dimensions of poverty. Apart from their intrinsic interest, poverty maps may be used to help guide the allocation of resources across local agencies or governmental units, in an effort to better target efforts to reach the poor by pinpointing the small areas of most need.
In 2015, the National Institute of Statistics of Rwanda (NISR) published the Rwanda Poverty Profile Report which provided a detailed portrait of the extent and nature of poverty in the country, while in 2016 a Poverty Trends Analysis Report which complements the Profile study by looking at the trends in poverty between 2010/11 and 2013/14 was also published. Both reports were based on information collected by an integrated household living conditions survey (EICV4) undertaken between October 2013 and September 2014.
more
The Environmental Data Explorer is the authoritative source for data sets used by UNEP and its partners in the Global Environment Outlook (GEO) report and other integrated environment assessments. Its online database holds more than 500 different variables, as national, subregional, regional and glo
...
bal statistics or as geospatial data sets (maps), covering themes like Freshwater, Population, Forests, Emissions, Climate, Disasters, Health and GDP. Display them on-the-fly as maps, graphs, data tables or download the data in different formats.
more
The arrival and rapid spread of the mosquito-borne viral disease Chikungunya across the Americas is one of the most significant public health developments of recent years, preceding and mirroring the subsequent spread of Zika. Globalization in trade and travel can lead to the importation of these vi
...
ruses, but climatic conditions strongly affect the efficiency of transmission in local settings. In order to direct preparedness for future outbreaks, it is necessary to anticipate global regions that could become suitable for Chikungunya transmission. Here, we present global correlative niche models for autochthonous Chikungunya transmission. These models were used as the basis for projections under the representative concentration pathway (RCP) 4.5 and 8.5 climate change scenarios. In a further step, hazard maps, which account for population densities, were produced. The baseline models successfully delineate current areas of active Chikungunya transmission. Projections under the RCP 4.5 and 8.5 scenarios suggest the likelihood of expansion of transmission-suitable areas in many parts of the world, including China, sub-Saharan Africa, South America, the United States and continental Europe. The models presented here can be used to inform public health preparedness planning in a highly interconnected world.
more
Maps
Maximum point prevalence of schistosome inceftion and location of S. mansoni and S. haematobium surveys.
The Global Health Observatory map gallery includes an extensive list of maps on major health topics.
Accessed 26 February 2019.

Situation Reports; Maps and Infographics, Reports, Humanitarin Appeals
Epi Info™ is a public domain suite of interoperable software tools designed for the global community of public health practitioners and researchers. It provides for easy data entry form and database construction, a customized data entry experience, and data analyses with epidemiologic statistics,
...
maps, and graphs for public health professionals who may lack an information technology background. Epi Info™ is used for outbreak investigations; for developing small to mid-sized disease surveillance systems; as analysis, visualization, and reporting (AVR) components of larger systems; and in the continuing education in the science of epidemiology and public health analytic methods at schools of public health around the world.
more
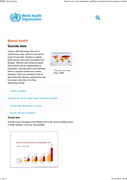
Close to 800 000 people die due to suicide every year, which is one person every 40 seconds. Suicide is a global phenomenon and occurs throughout the lifespan. Effective and evidence-based interventions can be implemented at population, sub-population and individual levels to prevent suicide and sui
...
cide attempts. There are indications that for each adult who died by suicide there may have been more than 20 others attempting suicide.
On this website you can download maps, data, graphics by region or country
more
Soil transmitted helminth (STH) infections are among the most common human infections worldwide with over 1 billion people affected. Many estimates of STH infection are often based on school-aged children (SAC). This study produced predictive risk-maps
...
of STH on a more finite scale, estimated the number of people infected, and the amount of drug required for preventive chemotherapy (PC) in Ogun state, Nigeria. Georeferenced STH infection data obtained from a cross-sectional survey at 33 locations between July 2016 and November 2018, together with remotely-sensed environmental and socio-economic data were analyzed using Bayesian geostatistical modelling. Stepwise variable selection procedure was employed to select a parsimonious set of predictors to predict risk and spatial distribution of STH infections. The number of persons (pre-school ages children, SAC and adults) infected with STH were estimated, with the amount of tablets needed for preventive chemotherapy. An overall prevalence of 17.2% (95% CI 14.9, 19.5) was recorded for any STH infection. Ascaris lumbricoides infections was the most predominant, with an overall prevalence of 13.6% (95% CI 11.5, 15.7), while Hookworm and Trichuris trichiura had overall prevalence of 4.6% (95% CI 3.3, 5.9) and 1.7% (95% CI 0.9, 2.4), respectively. The model-based prevalence predictions ranged from 5.0 to 23.8% for Ascaris lumbricoides, from 2.0 to 14.5% for hookworms, and from 0.1 to 5.7% for Trichuris trichiura across the implementation units. The predictive maps revealed a spatial pattern of high risk in the central, western and on the border of Republic of Benin. The model identified soil pH, soil moisture and elevation as the main predictors of infection for A. lumbricoides, Hookworms and T. trichiura respectively. About 50% (10/20) of the implementation units require biannual rounds of mass drug administration. Approximately, a total of 1.1 million persons were infected and require 7.8 million doses. However, a sub-total of 375,374 SAC were estimated to be infected, requiring 2.7 million doses. Our predictive risk maps and estimated PC needs provide useful information for the elimination of STH, either for resource acquisition or identifying priority areas for delivery of interventions in Ogun State, Nigeria.
more