Filter
23
Breadcrumb:
Our World in Data
Featured
7
Language
Document type
10
8
2
1
1
1
Countries
1
1
Authors & Publishers
Publication Years
Category
5
1
1
1
Toolboxes
3
3
3
2
2
2
1
1
1
1
1
1
1
1
1
1
1
1
1
1
The number of global reported natural disaster events in any given year. Note that this largely reflects increases in data reporting, and should notbe used to assess the total number of events.
The data on the coronavirus pandemic is updated daily
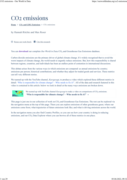
CO2 emissions
recommended
Carbon dioxide emissions are the primary driver of global climate change. It’s widely recognised that to avoid the worst impacts of climate change, the world needs to urgently reduce emissions. But, how this responsibility is shared between regions, countries, and individuals has been an endless p
...
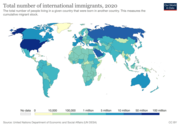
Migration, Refugee and Asylum Data Explorer
recommended
Explore the migration of people across the world.
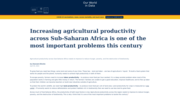
Agricultural productivity across Sub-Saharan Africa needs to improve to reduce hunger, poverty, and the destruction of biodiversity.
Both Ukraine and Russia are some of the world’s largest food exporters. How could global food be impacted?
Here you can download different charts about cases by world region, prevalence rates, and progress towards polio eradication and much more.
Polio is an infectious disease that is caused and transmitted by the poliovirus. Most infections do not lead to any symptoms, but—among the unvaccinated—
...
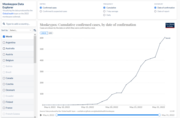
Monkeypox: Cumulative confirmed cases, by date of confirmation
Air Pollution Data Explorer
recommended
Explore historical emissions of air pollutants from fuel use globally.
Data Explorer Interactive Dashboard
The Living Planet Index is the biodiversity metric that always claims the headlines. It’s often misinterpreted. How should we understand it?
Our World in Data
recommended
Our World in Data is a non-profit website that brings together the data and research on the powerful, long-run trends reshaping our world: Through interactive data visualizations we show how the world has changed; by summarizing the scientific literature we explain why.
Accessed 26 February 2019.
...
We are working on Our World in Data to provide ‘Research and data to make progress against the world’s largest problems’.
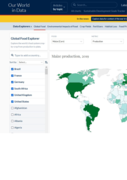
Global Food Explorer
recommended
Explore the world's food system crop-by-crop from production to plate.
Outdoor air pollution is one of the world's largest health and environmental problems. The Global Burden of Disease is a major global study on the causes and risk factors for death. These estimates of the annual number of deaths attributed to a wide range of risk factors are shown here. This chart i
...
Disease burden is measured in Disability-Adjusted Life Years (DALYs) – both from years of life lost due to premature death and years lived witha disability. One DALY equals one year of healthy life.
Estimated annual number of deaths from alcohol and drug use disorders per 100,000 people. These include only direct deaths from thesedisorders, meaning they do not include suicide deaths which can in some cases be connected or attributed to them.
Shown in blue is the estimated annual number of deaths attributed to drug use. Shown in red is theestimated annual number of deaths from drug use disorders. The difference between them is that theyrelate to indirect and direct causes of death, respectively.
Estimated annual number of deaths from drug use disorders per 100,000 people.